Filters: Tags: Paradox (X)
20 results (10ms)|
Filters
Date Range
Extensions Types Contacts
Categories Tag Types Tag Schemes |
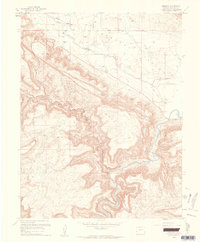
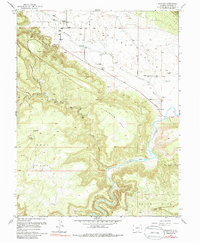
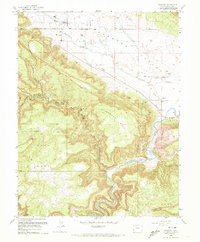
USGS Historical Quadrangle in GeoPDF.

USGS Historical Quadrangle in GeoPDF.
This paper empirically examines the dynamic causal relationships between carbon dioxide emissions, energy consumption, economic growth, trade openness and urbanization for the panel of newly industrialized countries (NIC) using the time series data for the period 1971–2007. Using four different panel unit root tests it is found that all panel variables are integrated of order 1. From the Johansen Fisher panel cointegration test it is found that there is a cointegration vector among the variables. The Granger causality test results support that there is no evidence of long-run causal relationship, but there is unidirectional short-run causal relationship from economic growth and trade openness to carbon dioxide emissions,...
This paper empirically examines the dynamic causal relationships between carbon dioxide emissions, energy consumption, economic growth, trade openness and urbanization for the panel of newly industrialized countries (NIC) using the time series data for the period 1971–2007. Using four different panel unit root tests it is found that all panel variables are integrated of order 1. From the Johansen Fisher panel cointegration test it is found that there is a cointegration vector among the variables. The Granger causality test results support that there is no evidence of long-run causal relationship, but there is unidirectional short-run causal relationship from economic growth and trade openness to carbon dioxide emissions,...
This data set contains imagery from the National Agriculture Imagery Program (NAIP). The NAIP program is administered by USDA FSA and has been established to support two main FSA strategic goals centered on agricultural production. These are, increase stewardship of America's natural resources while enhancing the environment, and to ensure commodities are procured and distributed effectively and efficiently to increase food security. The NAIP program supports these goals by acquiring and providing ortho imagery that has been collected during the agricultural growing season in the U.S. The NAIP ortho imagery is tailored to meet FSA requirements and is a fundamental tool used to support FSA farm and conservation programs....
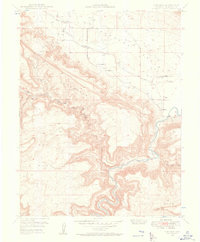
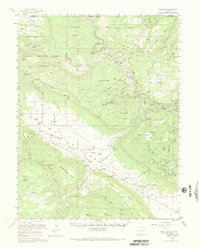
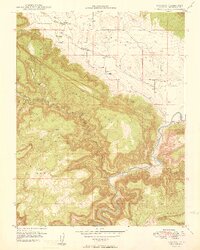
USGS Historical Quadrangle in GeoPDF.
USGS Historical Quadrangle in GeoPDF.
USGS Historical Quadrangle in GeoPDF.
This data set contains imagery from the National Agriculture Imagery Program (NAIP). The NAIP program is administered by USDA FSA and has been established to support two main FSA strategic goals centered on agricultural production. These are, increase stewardship of America's natural resources while enhancing the environment, and to ensure commodities are procured and distributed effectively and efficiently to increase food security. The NAIP program supports these goals by acquiring and providing ortho imagery that has been collected during the agricultural growing season in the U.S. The NAIP ortho imagery is tailored to meet FSA requirements and is a fundamental tool used to support FSA farm and conservation programs....
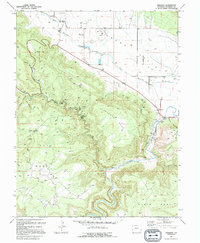
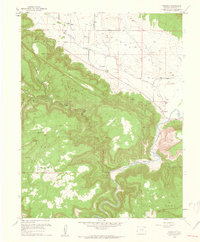
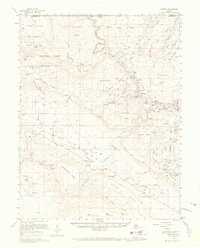
USGS Historical Quadrangle in GeoPDF.
USGS Historical Quadrangle in GeoPDF.
This paper empirically examines the dynamic causal relationships between carbon dioxide emissions, energy consumption, economic growth, trade openness and urbanization for the panel of newly industrialized countries (NIC) using the time series data for the period 1971–2007. Using four different panel unit root tests it is found that all panel variables are integrated of order 1. From the Johansen Fisher panel cointegration test it is found that there is a cointegration vector among the variables. The Granger causality test results support that there is no evidence of long-run causal relationship, but there is unidirectional short-run causal relationship from economic growth and trade openness to carbon dioxide emissions,...
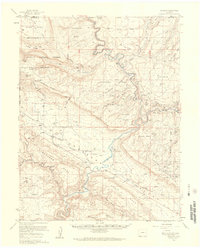
USGS Historical Quadrangle in GeoPDF.
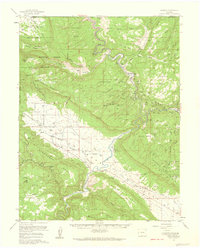
USGS Historical Quadrangle in GeoPDF.
This data set contains imagery from the National Agriculture Imagery Program (NAIP). The NAIP program is administered by USDA FSA and has been established to support two main FSA strategic goals centered on agricultural production. These are, increase stewardship of America's natural resources while enhancing the environment, and to ensure commodities are procured and distributed effectively and efficiently to increase food security. The NAIP program supports these goals by acquiring and providing ortho imagery that has been collected during the agricultural growing season in the U.S. The NAIP ortho imagery is tailored to meet FSA requirements and is a fundamental tool used to support FSA farm and conservation programs....
This data set contains imagery from the National Agriculture Imagery Program (NAIP). The NAIP program is administered by USDA FSA and has been established to support two main FSA strategic goals centered on agricultural production. These are, increase stewardship of America's natural resources while enhancing the environment, and to ensure commodities are procured and distributed effectively and efficiently to increase food security. The NAIP program supports these goals by acquiring and providing ortho imagery that has been collected during the agricultural growing season in the U.S. The NAIP ortho imagery is tailored to meet FSA requirements and is a fundamental tool used to support FSA farm and conservation programs....
This paper empirically examines the dynamic causal relationships between carbon dioxide emissions, energy consumption, economic growth, trade openness and urbanization for the panel of newly industrialized countries (NIC) using the time series data for the period 1971–2007. Using four different panel unit root tests it is found that all panel variables are integrated of order 1. From the Johansen Fisher panel cointegration test it is found that there is a cointegration vector among the variables. The Granger causality test results support that there is no evidence of long-run causal relationship, but there is unidirectional short-run causal relationship from economic growth and trade openness to carbon dioxide emissions,...
USGS Historical Quadrangle in GeoPDF.
USGS Historical Quadrangle in GeoPDF.
USGS Historical Quadrangle in GeoPDF.
|

|
