Filters: Tags: Parkfield (X)
16 results (15ms)|
Filters
Contacts
(Less)
|
This data set contains imagery from the National Agriculture Imagery Program (NAIP). The NAIP program is administered by USDA FSA and has been established to support two main FSA strategic goals centered on agricultural production. These are, increase stewardship of America's natural resources while enhancing the environment, and to ensure commodities are procured and distributed effectively and efficiently to increase food security. The NAIP program supports these goals by acquiring and providing ortho imagery that has been collected during the agricultural growing season in the U.S. The NAIP ortho imagery is tailored to meet FSA requirements and is a fundamental tool used to support FSA farm and conservation programs....
The original time series and cross power data were stored in Binary format on 3.5" disks until further conversion was needed. To convert the time series and cross power data to a format that can be used for modeling, the original binary files were converted to ASCII format using Basic 4.0 code and associated subroutines (see Magnetotelluric_Original-Code_Binary-to-Ascii.txt and Magnetotelluric_Original-Code_Binary-to-Ascii-Subroutines.txt attached to the binary data ScienceBase item). The DaR project used these converted ASCII format files to create the EDI format files included in this data release. The binary data are considered the original data for the magnetotelluric survey, therefore, they are provided with...
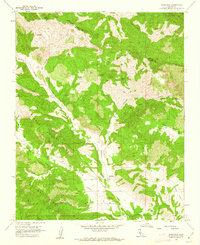
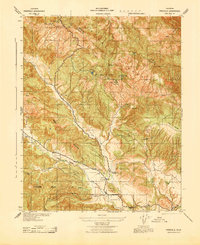
USGS Historical Quadrangle in GeoPDF.
This data set contains imagery from the National Agriculture Imagery Program (NAIP). The NAIP program is administered by USDA FSA and has been established to support two main FSA strategic goals centered on agricultural production. These are, increase stewardship of America's natural resources while enhancing the environment, and to ensure commodities are procured and distributed effectively and efficiently to increase food security. The NAIP program supports these goals by acquiring and providing ortho imagery that has been collected during the agricultural growing season in the U.S. The NAIP ortho imagery is tailored to meet FSA requirements and is a fundamental tool used to support FSA farm and conservation programs....
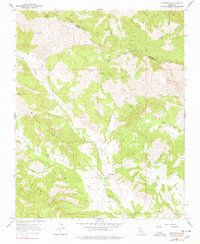
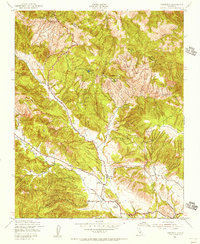
The U.S. Geological Survey (USGS) Geology, Geophysics and Geochemistry Science Center (GGGSC) collaborated with the USGS Data at Risk (DaR) team to preserve and release a subset of magnetotelluric data from the San Andreas Fault in Parkfield, California. The San Andreas Fault data were collected by the Branch of Geophysics, a precursor to the now GGGSC, between 1989 and 1994. The magnetotelluric data selected for this preservation project were collected in 1990 using USGS portable truck mounted systems that measure the distribution of electrical conductivity beneath the surface of the earth. Truck mounted systems of this era output data to 3.5” discs, from which data were recovered and transformed to binary or ASCII...
Types: Map Service,
OGC WFS Layer,
OGC WMS Layer,
OGC WMS Service;
Tags: California,
EDI,
Electrical Data Interchange,
Fresno County,
Map Service,
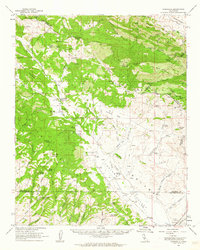
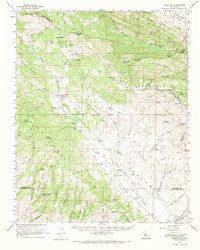
USGS Historical Quadrangle in GeoPDF.
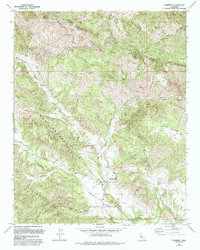
USGS Historical Quadrangle in GeoPDF.
The EDI time series and cross power data were converted from ASCII format using Python-based software developed for this preservation project. The data in EDI format can use magnetotelluric interpretation software to produce models of the resistivity of the measured environment. The metadata in the Info section of the EDI files can be used to convert data to SPUD format, another format used for modelling (Wight, 1988).
We present whole-rock geochemical analyses of 27 Phase 3 core samples obtained from Hole G of the San Andreas Fault Observatory at Depth, which crosses the creeping section of the San Andreas Fault ~14 km NW of Parkfield, California. These new data will essentially double the published whole-rock chemical dataset for the SAFOD Hole G core. Two, meters-wide zones of foliated gouge where fault creep is concentrated were successfully cored in Hole G. The gouge zones are bounded on either side by variably deformed structural units of sedimentary rock. Sampling for this dataset was focused on the gouge-wall rock boundaries and meters-long sections of the wall rocks that previously lacked chemical data. Major, trace,...
Categories: Data;
Tags: Geochemistry,
Geochemistry,
Parkfield,
San Luis Obispo County,
Structural Geology,
USGS Historical Quadrangle in GeoPDF.
This data set contains imagery from the National Agriculture Imagery Program (NAIP). The NAIP program is administered by USDA FSA and has been established to support two main FSA strategic goals centered on agricultural production. These are, increase stewardship of America's natural resources while enhancing the environment, and to ensure commodities are procured and distributed effectively and efficiently to increase food security. The NAIP program supports these goals by acquiring and providing ortho imagery that has been collected during the agricultural growing season in the U.S. The NAIP ortho imagery is tailored to meet FSA requirements and is a fundamental tool used to support FSA farm and conservation programs....
USGS Historical Quadrangle in GeoPDF.
USGS Historical Quadrangle in GeoPDF.
The ASCII data included in this data release are the intermediary files between the original binary and final EDI formatted files. These ASCII formatted time series and cross power files are what the DaR project acquired and converted into EDI format for this data release using open-source software developed by the DaR project team (Wight, D.E., 1988). The Python code, supplemental resources, and associated readme are available as a USGS software release (https://doi.org/10.5066/F71Z43P9).
|

|
