Filters: Tags: Peoria (X)
207 results (10ms)|
Filters
Date Range
Extensions Types
Contacts
Categories Tag Types Tag Schemes |
The bathymetry (bottom elevation) of the downstream lock approach and lock chamber of Peoria Lock, near Peoria, Illinois, was surveyed on September 19, 2019. The data were collected using a multibeam echo-sounder mapping system (MBMS) with integrated inertial navigation solution (INS) mounted on a manned survey vessel. The raw data were processed and gridded to 0.5 meter using elevation values computed from the Combined Uncertainty and Bathymetry Estimator (CUBE) method, which provides an estimate of the bathymetric elevation and the total propagated uncertainty (TPU) at each gridded location. The 0.5 meter grid was oriented at 39.32 degrees to north to be aligned with the Peoria lock chamber. The bathymetry and...
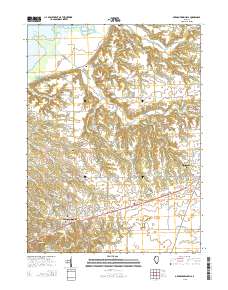
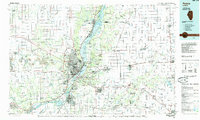
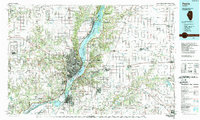
Layered GeoPDF 7.5 Minute Quadrangle Map. Layers of geospatial data include orthoimagery, roads, grids, geographic names, elevation contours, hydrography, and other selected map features.
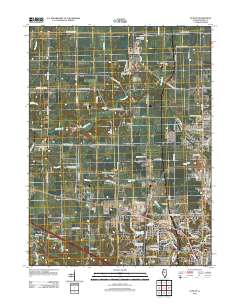
Layered GeoPDF 7.5 Minute Quadrangle Map. Layers of geospatial data include orthoimagery, roads, grids, geographic names, elevation contours, hydrography, and other selected map features.
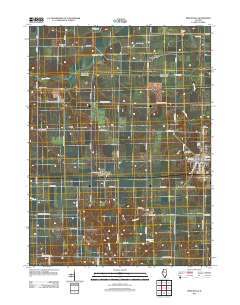
Layered GeoPDF 7.5 Minute Quadrangle Map. Layers of geospatial data include orthoimagery, roads, grids, geographic names, elevation contours, hydrography, and other selected map features.
The U.S. Army Corps of Engineers' Upper Mississippi River Restoration (UMRR) Program Long Term Resource Monitoring (LTRM) element has overseen the collection, processing, and serving of bathymetric data since 1989. A systemic data collection for the Upper Mississippi River System (UMRS) was completed in 2010. Water depth in aquatic systems is important for describing the physical characteristics of a river. Bathymetric maps are used for conducting spatial inventories of the aquatic habitat and detecting bed and elevation changes due to sedimentation. Bathymetric data is widely used, specifically for studies of water level management alternatives, modeling navigation impacts and hydraulic conditions, and environmental...
Categories: Data;
Types: Citation,
Downloadable,
Map Service,
OGC WFS Layer,
OGC WMS Layer,
Shapefile;
Tags: Illinois,
Illinois River,
Illinois Waterway,
LIDAR,
Peoria,
Using high-resolution sonar technologies with geographic information systems (GIS) and object based image analysis, benthic characteristics of the Illinois River have been interpreted to support Asian carp research, monitoring and control. The study plan consisted of data collection and analysis of the Brandon, Dresden, Starved Rock, Marseilles, Peoria, La Grange and Alton reaches of the Illinois River. Reaches with larger aquatic areas (Peoria, La Grange and Alton), had areas prioritized for data collection and analysis.
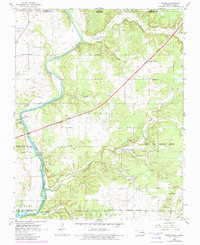
USGS Historical Quadrangle in GeoPDF.
USGS Historical Quadrangle in GeoPDF.
USGS Historical Quadrangle in GeoPDF.
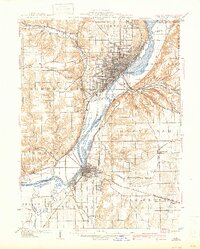
USGS Historical Quadrangle in GeoPDF.
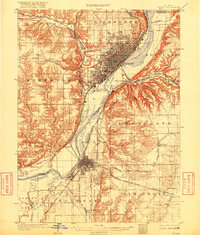
USGS Historical Quadrangle in GeoPDF.
Using high-resolution sonar technologies with geographic information systems (GIS) and object based image analysis, benthic habitats of the Illinois River will be interpreted to support Asian carp research, monitoring and control. The entire study plan will consist of data collection and analysis of the Brandon, Dresden, Starved Rock, Marseilles, Peoria, La Grange and Alton reaches of the Illinois River. Reaches with larger aquatic areas (Peoria, La Grange and Alton), will have priority areas and backwaters collected and analyzed first.
Using high-resolution sonar technologies with geographic information systems (GIS) and object based image analysis, benthic habitats of the Illinois River will be interpreted to support Asian carp research, monitoring and control. The entire study plan will consist of data collection and analysis of the Brandon, Dresden, Starved Rock, Marseilles, Peoria, La Grange and Alton reaches of the Illinois River. Reaches with larger aquatic areas (Peoria, La Grange and Alton), will have priority areas and backwaters collected and analyzed first.
This data represents the map extent for current and historical USGS topographic maps for the United States and Territories, including 1 X 2 Degree, 1 X 1 Degree, 30 X 60 Minute, 15 X 15 Minute, 7.5 X 7.5 Minute, and 3.75 X 3.75 Minute. The grid was generated using ESRI ArcInfo GIS software.

This data represents the map extent for current and historical USGS topographic maps for the United States and Territories, including 1 X 2 Degree, 1 X 1 Degree, 30 X 60 Minute, 15 X 15 Minute, 7.5 X 7.5 Minute, and 3.75 X 3.75 Minute. The grid was generated using ESRI ArcInfo GIS software.
Geospatial data includes structures and other selected map features.
This data set contains imagery from the National Agriculture Imagery Program (NAIP). The NAIP program is administered by USDA FSA and has been established to support two main FSA strategic goals centered on agricultural production. These are, increase stewardship of America's natural resources while enhancing the environment, and to ensure commodities are procured and distributed effectively and efficiently to increase food security. The NAIP program supports these goals by acquiring and providing ortho imagery that has been collected during the agricultural growing season in the U.S. The NAIP ortho imagery is tailored to meet FSA requirements and is a fundamental tool used to support FSA farm and conservation programs....
This data set contains imagery from the National Agriculture Imagery Program (NAIP). The NAIP program is administered by USDA FSA and has been established to support two main FSA strategic goals centered on agricultural production. These are increase stewardship of America's natural resources while enhancing the environment, and to ensure commodities are procured and distributed effectively and efficiently to increase food security. The NAIP program supports these goals by acquiring and providing ortho imagery that has been collected during the agricultural growing season in the U.S. The NAIP ortho imagery is tailored to meet FSA requirements and is a fundamental tool used to support FSA farm and conservation programs....
This data set contains imagery from the National Agriculture Imagery Program (NAIP). The NAIP program is administered by USDA FSA and has been established to support two main FSA strategic goals centered on agricultural production. These are, increase stewardship of America's natural resources while enhancing the environment, and to ensure commodities are procured and distributed effectively and efficiently to increase food security. The NAIP program supports these goals by acquiring and providing ortho imagery that has been collected during the agricultural growing season in the U.S. The NAIP ortho imagery is tailored to meet FSA requirements and is a fundamental tool used to support FSA farm and conservation programs....
This data set contains imagery from the National Agriculture Imagery Program (NAIP). The NAIP program is administered by USDA FSA and has been established to support two main FSA strategic goals centered on agricultural production. These are, increase stewardship of America's natural resources while enhancing the environment, and to ensure commodities are procured and distributed effectively and efficiently to increase food security. The NAIP program supports these goals by acquiring and providing ortho imagery that has been collected during the agricultural growing season in the U.S. The NAIP ortho imagery is tailored to meet FSA requirements and is a fundamental tool used to support FSA farm and conservation programs....
|

|
