Filters: Tags: Peru (X)
129 results (10ms)|
Filters
Contacts
(Less)
|
This data set contains imagery from the National Agriculture Imagery Program (NAIP). The NAIP program is administered by USDA FSA and has been established to support two main FSA strategic goals centered on agricultural production. These are, increase stewardship of America's natural resources while enhancing the environment, and to ensure commodities are procured and distributed effectively and efficiently to increase food security. The NAIP program supports these goals by acquiring and providing ortho imagery that has been collected during the agricultural growing season in the U.S. The NAIP ortho imagery is tailored to meet FSA requirements and is a fundamental tool used to support FSA farm and conservation programs....
The Critical Minerals in Archived Mine Samples Database (CMDB) contains chemistry and geologic information for historic ore and ore-related rock samples from mineral deposits in the United States. In addition, the database contains samples from archetypal deposits from 27 other countries in North America, South America, Asia, Africa and Europe. Samples were obtained from archived ore collections under the U.S. Geological Survey's project titled "Quick Assessment of Rare and Critical Metals in Ore Deposits: A National Assessment" (2008 to 2013) in an effort to begin an assessment of the Nations' previously mined ore deposits for critical minerals. Mineralized and altered rock samples were provided by the Colorado...
Categories: Data;
Types: ArcGIS REST Map Service,
ArcGIS Service Definition,
Downloadable,
Map Service,
OGC WFS Layer,
OGC WMS Layer,
Shapefile;
Tags: Alaska,
Argentina,
Arizona,
Arkansas,
Australia,
North Peak of Nevados Huascaran, the source of debris avalanche that buried the town of Yungay and Ronrajirca. An estimated 25-50 million cubic waters of and ice broke from the part of the peak in shadow. Peru. 1970.
Peru Earthquake May 31, 1970. Nevados Hascaran, showing the area overrun by the upper part of the debris avalanche (outlined by dashed line): Moraines, M, below Glacier 511 and between Rio Shacsha and Quebrada Armapampa, and areas splattered by airborn mud and boulders. June-July 1970.
Categories: Image;
Types: Map Service,
OGC WFS Layer,
OGC WMS Layer,
OGC WMS Service;
Tags: Earthquakes,
Peru,
Peru Earthquake May 31, 1970,
Photographers,
Plafker, G. Collection,
Peru Earthquake May 31, 1970. Damage from the flood wave at the power company camp near Huallanca, which is visible in background. The wave, 20 meters deep at this point, swept away homes that formerly covered the level area in this view and deposited a layer of mud and rocks. The fence posts in the foreground are bent in the direction of the flow. June-July 1970.
Categories: Image;
Tags: Earthquakes,
Peru,
Peru Earthquake May 31, 1970,
Photographers,
Plafker, G. Collection,
This data set contains imagery from the National Agriculture Imagery Program (NAIP). The NAIP program is administered by USDA FSA and has been established to support two main FSA strategic goals centered on agricultural production. These are, increase stewardship of America's natural resources while enhancing the environment, and to ensure commodities are procured and distributed effectively and efficiently to increase food security. The NAIP program supports these goals by acquiring and providing ortho imagery that has been collected during the agricultural growing season in the U.S. The NAIP ortho imagery is tailored to meet FSA requirements and is a fundamental tool used to support FSA farm and conservation programs....
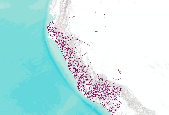
A seismic hazard model for South America, based on a smoothed (gridded) seismicity model, a subduction model, a crustal fault model, and a ground motion model, has been produced by the U.S. Geological Survey. These models are combined to account for ground shaking from earthquakes on known faults as well as earthquakes on un-modeled faults. This data set represents the results of calculations of hazard curves for a grid of points with a spacing of 0.1 degrees in latitude and longitude. This particular data set is for peak ground acceleration with a 10 percent probability of exceedance in 50 years.
Categories: Data;
Types: Citation,
Downloadable,
Map Service,
OGC WFS Layer,
OGC WMS Layer,
Shapefile;
Tags: Argentina,
Bolivia,
Brazil,
Chile,
Colombia,
A seismic hazard model for South America, based on a smoothed (gridded) seismicity model, a subduction model, a crustal fault model, and a ground motion model, has been produced by the U.S. Geological Survey. These models are combined to account for ground shaking from earthquakes on known faults as well as earthquakes on un-modeled faults. This data set represents the results of calculations of hazard curves for a grid of points with a spacing of 0.1 degrees in latitude and longitude. This particular data set is for horizontal spectral response acceleration for 0.2-second period with a 50 percent probability of exceedance in 50 years.
Categories: Data;
Types: Citation,
Downloadable,
Map Service,
OGC WFS Layer,
OGC WMS Layer,
Shapefile;
Tags: Argentina,
Bolivia,
Brazil,
Chile,
Colombia,
The Digital Chart of the World (DCW) is an Environmental Systems Research Institute, Inc. (ESRI) product originally developed for the US Defense Mapping Agency (DMA) using DMA data. The DCW 1993 version at 1:1,000,000 scale was used. The DMA data sources are aeronautical charts, which emphasize landmarks important from flying altitudes. This explains why there is a separate aeronautical theme with all conceivable airports, yet why on some themes small islands and lakes are simply unnamed points. ESRI, in compiling the DCW, also eliminated some detail and made some assumptions for handling tiny polygons and edgematching. Also, note that the completeness of the thematic categories present in each layer will vary....
A seismic hazard model for South America, based on a smoothed (gridded) seismicity model, a subduction model, a crustal fault model, and a ground motion model, has been produced by the U.S. Geological Survey. These models are combined to account for ground shaking from earthquakes on known faults as well as earthquakes on un-modeled faults. This data set represents the results of calculations of hazard curves for a grid of points with a spacing of 0.1 degrees in latitude and longitude. This particular data set is for horizontal spectral response acceleration for 1.0-second period with a 10 percent probability of exceedance in 50 years.
Categories: Data;
Types: Citation,
Downloadable,
Map Service,
OGC WFS Layer,
OGC WMS Layer,
Shapefile;
Tags: Argentina,
Bolivia,
Brazil,
Chile,
Colombia,
This data set contains imagery from the National Agriculture Imagery Program (NAIP). The NAIP program is administered by USDA FSA and has been established to support two main FSA strategic goals centered on agricultural production. These are increase stewardship of America's natural resources while enhancing the environment, and to ensure commodities are procured and distributed effectively and efficiently to increase food security. The NAIP program supports these goals by acquiring and providing ortho imagery that has been collected during the agricultural growing season in the U.S. The NAIP ortho imagery is tailored to meet FSA requirements and is a fundamental tool used to support FSA farm and conservation programs....
The Andes Mountains of South America host significant porphyry copper deposits. The region is the major global source of copper and an area of active mining, exploration, and development. The Andes region was included in USGS global compilations of porphyry deposits published by Singer and others in 2005 and 2008. Since that time, many new discoveries and new resource data have become available. This compilation includes new and updated location, references, and grade and tonnage data for porphyry copper deposits in the Andes along with grade and tonnage data from the previous compilations. The data release includes a data table, references, and shapefiles of porphyry copper locations and political boundaries.
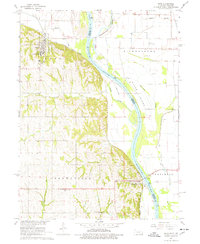
USGS Historical Quadrangle in GeoPDF.
Peru Earthquake May 31, 1970. Field west of the Rio Shacsha that was pockmarked by boulders hurled cross the Rio Shacsha valley. Most of the rocks are projectiles derived from the Huascaran debris avalanche. June-July 1970.
Peru Earthquake October 3, 1974. Heavily damaged building in the Lima area after the magnitude 7.6 shock. 1974. Earthquake Information Bulletin, v. 7, no. 2, p. 11.
Categories: Image;
Types: Map Service,
OGC WFS Layer,
OGC WMS Layer,
OGC WMS Service;
Tags: Earthquakes,
Peru,
Peru Earthquake October 3, 1974,
photo print
This data set contains imagery from the National Agriculture Imagery Program (NAIP). The NAIP program is administered by USDA FSA and has been established to support two main FSA strategic goals centered on agricultural production. These are increase stewardship of America's natural resources while enhancing the environment, and to ensure commodities are procured and distributed effectively and efficiently to increase food security. The NAIP program supports these goals by acquiring and providing ortho imagery that has been collected during the agricultural growing season in the U.S. The NAIP ortho imagery is tailored to meet FSA requirements and is a fundamental tool used to support FSA farm and conservation programs....
This data set contains imagery from the National Agriculture Imagery Program (NAIP). The NAIP program is administered by USDA FSA and has been established to support two main FSA strategic goals centered on agricultural production. These are increase stewardship of America's natural resources while enhancing the environment, and to ensure commodities are procured and distributed effectively and efficiently to increase food security. The NAIP program supports these goals by acquiring and providing ortho imagery that has been collected during the agricultural growing season in the U.S. The NAIP ortho imagery is tailored to meet FSA requirements and is a fundamental tool used to support FSA farm and conservation programs....
This data set contains imagery from the National Agriculture Imagery Program (NAIP). The NAIP program is administered by USDA FSA and has been established to support two main FSA strategic goals centered on agricultural production. These are increase stewardship of America's natural resources while enhancing the environment, and to ensure commodities are procured and distributed effectively and efficiently to increase food security. The NAIP program supports these goals by acquiring and providing ortho imagery that has been collected during the agricultural growing season in the U.S. The NAIP ortho imagery is tailored to meet FSA requirements and is a fundamental tool used to support FSA farm and conservation programs....
We estimate the Marginal Cost of Public Funds (MCPF) for Peru using a detailed computable general equilibrium (CGE) model. Revenues from all major sources (including taxes on factors of production, natural resources such as energy and minerals, consumption, and imports) are examined. Our focus is on the efficiency implications of mineral and energy taxes, given their importance to Peruvian public finance. The primary data are from the Global Trade Analysis Project (GTAP) as modified to include detailed tax information from the Peruvian Ministry of Economy and Finance and the Peruvian Internal Revenue Service. Consistent with the theories of public finance, we find that the MCPF is greater for activities that face...
Categories: Publication;
Types: Citation;
Tags: Computable general equilibrium,
Energy taxes,
Marginal cost of public funds,
Mineral taxes,
Peru,
A comparison of the 2017 USGS South America seismic hazard model and the 2010 USGS preliminary model was made to see how the models differ. The comparison was made as the ratio of PGA at 10% probability of exceedance in 50 years. The ratio map is included here as a geo-referenced tiff (GeoTIFF). The gridded data for the 2017 PGA at 10% probability can be found here, while the gridded data for the 2010 PGA at 10% probability can be found in the zip archive that can be downloaded using a link on this page.
Categories: Data;
Types: Citation,
Downloadable,
GeoTIFF,
Map Service,
OGC WFS Layer,
OGC WMS Layer,
Raster,
Shapefile;
Tags: Argentina,
Bolivia,
Brazil,
Chile,
Colombia,
|

|
