Filters: Tags: Prowers County (X)
172 results (91ms)|
Filters
Date Range
Extensions Types Contacts
Categories Tag Types Tag Schemes |
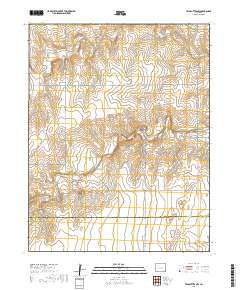
Layered geospatial PDF 7.5 Minute Quadrangle Map. Layers of geospatial data include orthoimagery, roads, grids, geographic names, elevation contours, hydrography, and other selected map features. This map is derived from GIS (geospatial information system) data. It represents a repackaging of GIS data in traditional map form, not creation of new information. The geospatial data in this map are from selected National Map data holdings and other government sources.
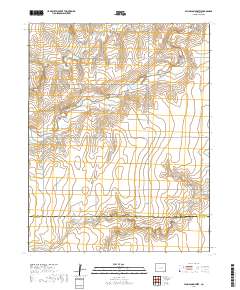
Layered geospatial PDF 7.5 Minute Quadrangle Map. Layers of geospatial data include orthoimagery, roads, grids, geographic names, elevation contours, hydrography, and other selected map features. This map is derived from GIS (geospatial information system) data. It represents a repackaging of GIS data in traditional map form, not creation of new information. The geospatial data in this map are from selected National Map data holdings and other government sources.
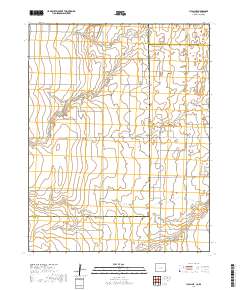
Layered geospatial PDF 7.5 Minute Quadrangle Map. Layers of geospatial data include orthoimagery, roads, grids, geographic names, elevation contours, hydrography, and other selected map features. This map is derived from GIS (geospatial information system) data. It represents a repackaging of GIS data in traditional map form, not creation of new information. The geospatial data in this map are from selected National Map data holdings and other government sources.
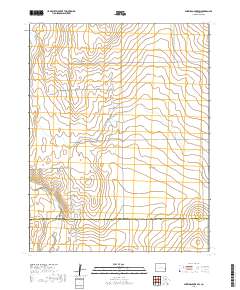
Layered geospatial PDF 7.5 Minute Quadrangle Map. Layers of geospatial data include orthoimagery, roads, grids, geographic names, elevation contours, hydrography, and other selected map features. This map is derived from GIS (geospatial information system) data. It represents a repackaging of GIS data in traditional map form, not creation of new information. The geospatial data in this map are from selected National Map data holdings and other government sources.
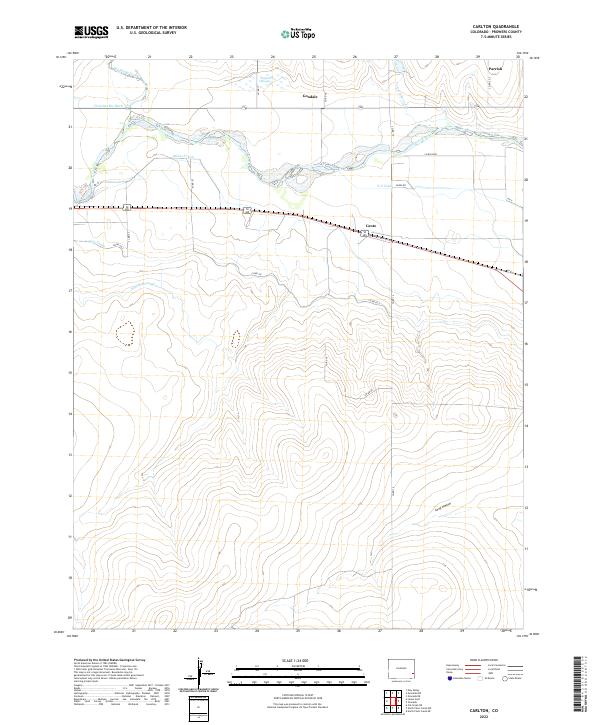
Layered geospatial PDF 7.5 Minute Quadrangle Map. Layers of geospatial data include orthoimagery, roads, grids, geographic names, elevation contours, hydrography, and other selected map features. This map is derived from GIS (geospatial information system) data. It represents a repackaging of GIS data in traditional map form, not creation of new information. The geospatial data in this map are from selected National Map data holdings and other government sources.
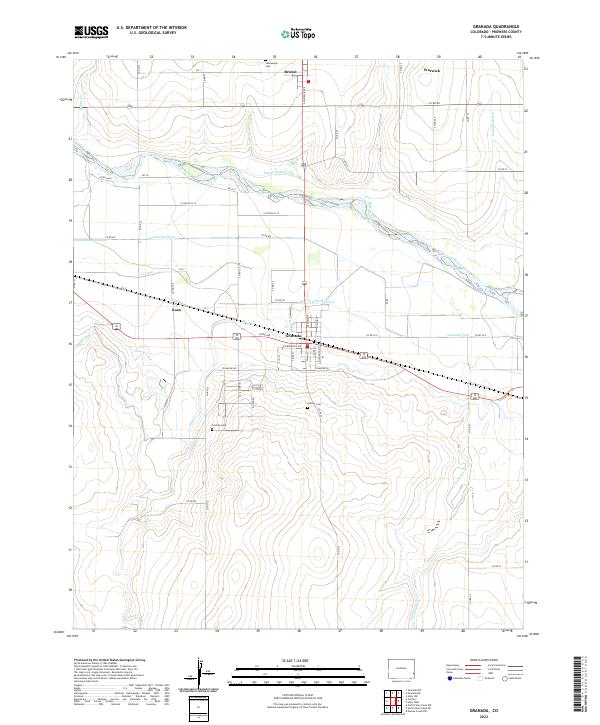
Layered geospatial PDF 7.5 Minute Quadrangle Map. Layers of geospatial data include orthoimagery, roads, grids, geographic names, elevation contours, hydrography, and other selected map features. This map is derived from GIS (geospatial information system) data. It represents a repackaging of GIS data in traditional map form, not creation of new information. The geospatial data in this map are from selected National Map data holdings and other government sources.
Layered geospatial PDF 7.5 Minute Quadrangle Map. Layers of geospatial data include orthoimagery, roads, grids, geographic names, elevation contours, hydrography, and other selected map features. This map is derived from GIS (geospatial information system) data. It represents a repackaging of GIS data in traditional map form, not creation of new information. The geospatial data in this map are from selected National Map data holdings and other government sources.
Classified probability of suitable habitat for Black Tailed Prairie Dogs for each cell of raster. Classification is based on 4 probability cutoff levels with category 1 being low habitat suitability and category 4 being high habitat suitability. Categorized probability data is created from fitting a global third-order model to county level raster data. For details on model fitting and data used to produce categorized probability raster see report. https://www.fws.gov/science/catalog
Categories: Data;
Types: Downloadable,
GeoTIFF,
Map Service,
Raster;
Tags: Black Tailed Prairie Dogs,
Colorado,
Great Plains,
Habitat Suitability,
Prowers County,
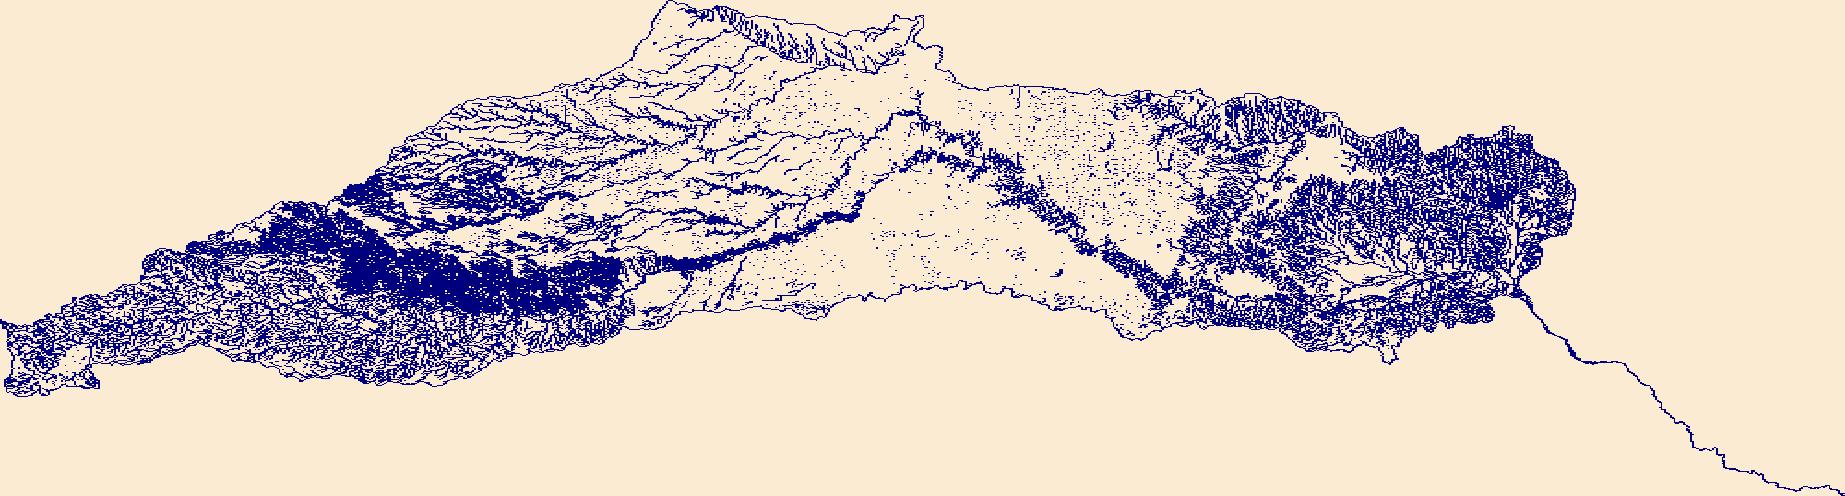
The High Resolution National Hydrography Dataset Plus (NHDPlus HR) is an integrated set of geospatial data layers, including the best available National Hydrography Dataset (NHD), the 10-meter 3D Elevation Program Digital Elevation Model (3DEP DEM), and the National Watershed Boundary Dataset (WBD). The NHDPlus HR combines the NHD, 3DEP DEMs, and WBD to create a stream network with linear referencing, feature naming, "value added attributes" (VAAs), elevation-derived catchments, and other features for hydrologic data analysis. The stream network with linear referencing is a system of data relationships applied to hydrographic systems so that one stream reach "flows" into another and "events" can be tied to and traced...
Raster dataset showing saturated thickness (in feet) of the alluvium in the Lower Arkansas River Valley, Southeast Colorado, June 1 - November 30, 2015 (hereafter defined as "fall"). Saturated thickness values based on water levels measured in the study area and median lake level at John Martin Reservoir during this time period. Surface interpolations for water-table altitude were done using Inverse Distance Weighting using coordinate and altitude data from "Wells and water-level altitude in the alluvium in the Lower Arkansas River Valley, Southeast Colorado, Spring and Fall 2002, 2008, and 2015" (see cross reference section in metadata), and surface interpolation of bedrock was done using Topo to Raster using elevation...
Categories: Data;
Types: Citation,
Downloadable,
GeoTIFF,
Map Service,
Raster;
Tags: Arkansas River,
Bent County,
Crowley County,
Groundwater Level,
Hydrogeology,
Raster showing change in water-table altitude between Spring of 2008 and Spring of 2015 in the alluvium in the Lower Arkansas River Valley, Southeast Colorado. Hereafter "spring" is defined as the periods of January 1 to May 31, and December 1 to December 31. All interpolation and geoprocessing was done using ArcGIS Desktop v10 (Environmental Systems Research Institute, 2011).
Categories: Data;
Types: Citation,
Downloadable,
GeoTIFF,
Map Service,
Raster;
Tags: Arkansas River,
Bent County,
Crowley County,
Otero County,
Prowers County,
Raster dataset showing saturated thickness (in feet) of the alluvium in the Lower Arkansas River Valley, Southeast Colorado, January 1 - May 31, 2008 and December 1 - 31, 2008 (hereafter defined as "spring"). Saturated thickness values based on water levels measured in the study area and median lake level at John Martin Reservoir during this time period. Surface interpolations for water-table altitude were done using Inverse Distance Weighting using coordinate and altitude data from "Wells and water-level altitude in the alluvium in the Lower Arkansas River Valley, Southeast Colorado, Spring and Fall 2002, 2008, and 2015" (see cross reference section in metadata), and surface interpolation of bedrock was done using...
Categories: Data;
Types: Citation,
Downloadable,
GeoTIFF,
Map Service,
Raster;
Tags: Arkansas River,
Bent County,
Crowley County,
Groundwater Level,
Hydrogeology,
Boundary of the alluvium in the Lower Arkansas River Valley, Southeast Colorado. Boundary defined by extent of available bedrock information and geologic maps. Also includes approximate shoreline of John Martin Reservoir in Bent County, Colorado. Scale of maps used for digitization was 1:62,500. All digitization and geoprocessing was done using ArcGIS Desktop v10 (Environmental Systems Research Institute, 2011)
Categories: Data;
Types: Citation,
Downloadable,
Map Service,
OGC WFS Layer,
OGC WMS Layer,
Shapefile;
Tags: Arkansas River,
Bent County,
Crowley County,
Groundwater Levels,
Hydrogeology,
Layered geospatial PDF 7.5 Minute Quadrangle Map. Layers of geospatial data include orthoimagery, roads, grids, geographic names, elevation contours, hydrography, and other selected map features. This map is derived from GIS (geospatial information system) data. It represents a repackaging of GIS data in traditional map form, not creation of new information. The geospatial data in this map are from selected National Map data holdings and other government sources.
Layered geospatial PDF 7.5 Minute Quadrangle Map. Layers of geospatial data include orthoimagery, roads, grids, geographic names, elevation contours, hydrography, and other selected map features. This map is derived from GIS (geospatial information system) data. It represents a repackaging of GIS data in traditional map form, not creation of new information. The geospatial data in this map are from selected National Map data holdings and other government sources.
Layered geospatial PDF 7.5 Minute Quadrangle Map. Layers of geospatial data include orthoimagery, roads, grids, geographic names, elevation contours, hydrography, and other selected map features. This map is derived from GIS (geospatial information system) data. It represents a repackaging of GIS data in traditional map form, not creation of new information. The geospatial data in this map are from selected National Map data holdings and other government sources.
Layered geospatial PDF 7.5 Minute Quadrangle Map. Layers of geospatial data include orthoimagery, roads, grids, geographic names, elevation contours, hydrography, and other selected map features. This map is derived from GIS (geospatial information system) data. It represents a repackaging of GIS data in traditional map form, not creation of new information. The geospatial data in this map are from selected National Map data holdings and other government sources.
Layered geospatial PDF 7.5 Minute Quadrangle Map. Layers of geospatial data include orthoimagery, roads, grids, geographic names, elevation contours, hydrography, and other selected map features. This map is derived from GIS (geospatial information system) data. It represents a repackaging of GIS data in traditional map form, not creation of new information. The geospatial data in this map are from selected National Map data holdings and other government sources.
Layered geospatial PDF 7.5 Minute Quadrangle Map. Layers of geospatial data include orthoimagery, roads, grids, geographic names, elevation contours, hydrography, and other selected map features. This map is derived from GIS (geospatial information system) data. It represents a repackaging of GIS data in traditional map form, not creation of new information. The geospatial data in this map are from selected National Map data holdings and other government sources.
Layered geospatial PDF 7.5 Minute Quadrangle Map. Layers of geospatial data include orthoimagery, roads, grids, geographic names, elevation contours, hydrography, and other selected map features. This map is derived from GIS (geospatial information system) data. It represents a repackaging of GIS data in traditional map form, not creation of new information. The geospatial data in this map are from selected National Map data holdings and other government sources.
|

|
