Filters: Tags: Puget Sound (X)
195 results (47ms)|
Filters
Date Range
Extensions
Types Contacts
Categories
Tag Types
|

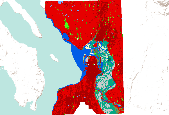
In order to predict the impacts of climate change induced sea-level rise on Pacific Northwest coastal habitats, the Sea Level Affecting Marshes Model (SLAMM) was utilized to simulate future coastal habitat configurations under various sea-level rise scenarios. The model was run for 2025, 2050, 2075, and 2100. Historical or "initial condition" habitat classifications are also available for some sites. The sea-level rise scenarios include: 1. A1B greenhouse gas emission mean : 0.39 meter rise by 2100 2. A1B greenhouse gas emission maximum : 0.69 meter rise by 2100 3. 1 meter rise by 2100 4. 1.5 meter rise by 2100 5. 2 meter rise by 2100 Due to differing site conditions, local sea-level rise varies slightly from...

In order to predict the impacts of climate change induced sea-level rise on Pacific Northwest coastal habitats, the Sea Level Affecting Marshes Model (SLAMM) was utilized to simulate future coastal habitat configurations under various sea-level rise scenarios. The model was run for 2025, 2050, 2075, and 2100. Historical or "initial condition" habitat classifications are also available for some sites. The sea-level rise scenarios include: 1. A1B greenhouse gas emission mean : 0.39 meter rise by 2100 2. A1B greenhouse gas emission maximum : 0.69 meter rise by 2100 3. 1 meter rise by 2100 4. 1.5 meter rise by 2100 5. 2 meter rise by 2100 Due to differing site conditions, local sea-level rise varies slightly from...

In order to predict the impacts of climate change induced sea-level rise on Pacific Northwest coastal habitats, the Sea Level Affecting Marshes Model (SLAMM) was utilized to simulate future coastal habitat configurations under various sea-level rise scenarios. The model was run for 2025, 2050, 2075, and 2100. Historical or "initial condition" habitat classifications are also available for some sites. The sea-level rise scenarios include: 1. A1B greenhouse gas emission mean : 0.39 meter rise by 2100 2. A1B greenhouse gas emission maximum : 0.69 meter rise by 2100 3. 1 meter rise by 2100 4. 1.5 meter rise by 2100 5. 2 meter rise by 2100 Due to differing site conditions, local sea-level rise varies slightly from...

In order to predict the impacts of climate change induced sea-level rise on Pacific Northwest coastal habitats, the Sea Level Affecting Marshes Model (SLAMM) was utilized to simulate future coastal habitat configurations under various sea-level rise scenarios. The model was run for 2025, 2050, 2075, and 2100. Historical or "initial condition" habitat classifications are also available for some sites. The sea-level rise scenarios include: 1. A1B greenhouse gas emission mean : 0.39 meter rise by 2100 2. A1B greenhouse gas emission maximum : 0.69 meter rise by 2100 3. 1 meter rise by 2100 4. 1.5 meter rise by 2100 5. 2 meter rise by 2100 Due to differing site conditions, local sea-level rise varies slightly from...
In order to predict the impacts of climate change induced sea-level rise on Pacific Northwest coastal habitats, the Sea Level Affecting Marshes Model (SLAMM) was utilized to simulate future coastal habitat configurations under various sea-level rise scenarios. The model was run for 2025, 2050, 2075, and 2100. Historical or "initial condition" habitat classifications are also available for some sites. The sea-level rise scenarios include: 1. A1B greenhouse gas emission mean : 0.39 meter rise by 2100 2. A1B greenhouse gas emission maximum : 0.69 meter rise by 2100 3. 1 meter rise by 2100 4. 1.5 meter rise by 2100 5. 2 meter rise by 2100 Due to differing site conditions, local sea-level rise varies slightly from...
Remote sensing based maps of tidal marshes, both of their extents and carbon stocks, have the potential to play a key role in conducting greenhouse gas inventories and implementing climate mitigation policies. Our objective was to generate a single remote sensing model of tidal marsh aboveground biomass and carbon that represents nationally diverse tidal marshes within the conterminous United States (CONUS). To meet this objective we developed the first national-scale dataset of aboveground tidal marsh biomass, species composition, and aboveground plant carbon content (%C) from six CONUS regions: Cape Cod, MA, Chesapeake Bay, MD, Everglades, FL, Mississippi Delta, LA, San Francisco Bay, CA, and Puget Sound, WA....
Categories: Data;
Tags: C-band synthetic aperture radar,
Cape Cod,
Chesapeake Bay,
National greenhouse gas inventory,
Puget Sound,
To support the modeling of storm-induced flooding, the USGS Coastal National Elevation Database (CoNED) Applications Project has created an integrated 1-meter topobathymetric digital elevation model (TBDEM) for Puget Sound. Puget Sound is located along the northwestern coast of Washington and is part of the Salish Sea. Puget Sound is the third largest estuary in the United States. High-resolution coastal elevation data is required to identify flood, storm, and sea-level rise inundation hazard zones and other earth science applications, such as the development of sediment transport and storm surge models. The new TBDEM consists of the best available multi-source topographic and bathymetric elevation data for Puget...
This archive contains the input data for the conceptual well locations for the logistic mapping. Data were computed for either the well location or within a buffer area of the well location, as specified in the parameter definition.
This archive contains the logistic mapping output vulnerability difference rasters at the conceptual well locations. Data are provided in rasters containing the differences between estimated probabilities of nitrate concentrations greater than 2 milligrams per liter at hypothetical 150 feet and 300 feet deep wells for sequential five-year categories when one or both of the predicted probabilities was equal to or greater than 50 percent.
Categories: Data;
Types: Downloadable,
GeoTIFF,
Map Service,
Raster;
Tags: Drinking Water,
Groundwater,
Puget Sound,
Washington,
Wells,
This portion of the data release presents topographic point clouds of the intertidal zone at Post Point, Bellingham Bay, WA. The point clouds were derived from structure-from-motion (SfM) processing of aerial imagery collected with an unmanned aerial system (UAS) on 2019-06-06. Two point clouds are presented with different resolutions: one point cloud (PostPoint_2019-06-06_pointcloud.zip) covers the entire survey area and has 145,653,2221 points with an average point density of 1,057 points per-square meter; the other point cloud (PostPointHighRes_2019-06-06_pointcloud.zip) has 139,427,055 points with an average point density of 3,487 points per-square meter and was derived from a lower-altitude flight covering...

These data were released prior to the October 1, 2016 effective date for the USGS’s policy dictating the review, approval, and release of scientific data as referenced in USGS Survey Manual Chapter 502.8 Fundamental Science Practices: Review and Approval of Scientific Data for Release. Under section 303(d) of the 1972 Clean Water Act, states, territories, and authorized tribes are required to develop lists of impaired waters. These impaired waters do not meet water quality standards that states, territories, and authorized tribes have set for them, even after point sources of pollution have installed the minimum required levels of pollution control technology. The law requires that these jurisdictions establish...
Septic systems are useful for removing and processing human waste. However, they have the potential of leaking or discharging waste into the nearby system and increasing potential contamination of nearby streams. Data represent potential locations of septic sewers in the Pacific Northwest based on extrapolation of 1990 Census tract block group level information.
This portion of the data release presents a high-resolution orthomosaic images of the intertidal zones at Puget Creek and Dickman Mill Park, Tacoma, WA. The orthomosaics have a resolution of 1.3 centimeters per pixel and were derived from structure-from-motion (SfM) processing of aerial imagery collected with an unmanned aerial system (UAS) on 2019-06-03. The raw imagery used to create the orthomosaics was acquired using a UAS fitted with a Ricoh GR II digital camera featuring a global shutter. The UAS was flown on pre-programmed autonomous flight lines at an approximate altitude of 50 meters above ground level (AGL). The flight lines were oriented roughly shore-parallel and were spaced to provide approximately...

This portion of the USGS data release presents eelgrass distribution and bathymetry data derived from acoustic surveys of the Nisqually River delta, Washington in 2012 (USGS Field Activity Number D-01-12-PS). Eelgrass and bathymetry data were collected from the R/V George Davidson equipped with a single-beam sonar system and global navigation satellite system (GNSS) receiver. The sonar system consisted of a Biosonics DT-X single-beam echosounder and 420 kHz transducer with a 6-degree beam angle. Depths from the echosounder were computed using sound velocity assuming a salinity of 30 psu and temperature of 10 degrees Celcius. Positioning of the survey vessel was determined at 5 to 10 Hz using a Trimble R7 GNSS receiver...
This part of the data release provides the U.S. Geological Survey (USGS), Pacific Coastal and Marine Science Center (PCMSC) merged bathymetry digital terrain model comprised of the 2005, 2007, and 2010 bathymetry data collected in Skagit Bay Washington that is provided as a 1-m resolution TIFF image, as well as a 1-m resolution shaded-relief TIFF image. FGDC metadata is also provided. In 2004, 2005, 2007, and 2010 the USGS, PCMSC collected bathymetry and acoustic backscatter data in Skagit Bay, Washington using an interferometric bathymetric sidescan sonar system mounded to the USGS R/V Parke Snavely and the USGS R/V Karluk. The research was conducted in coordination with the Swinomish Indian Tribal Community,...
Categories: Data;
Types: Citation;
Tags: Bathymetry,
Bathymetry,
Bathymetry and Elevation,
CMGP,
Coastal and Marine Geology Program,

In order to predict the impacts of climate change induced sea-level rise on Pacific Northwest coastal habitats, the Sea Level Affecting Marshes Model (SLAMM) was utilized to simulate future coastal habitat configurations under various sea-level rise scenarios. The model was run for 2025, 2050, 2075, and 2100. Historical or "initial condition" habitat classifications are also available for some sites. The sea-level rise scenarios include: 1. A1B greenhouse gas emission mean : 0.39 meter rise by 2100 2. A1B greenhouse gas emission maximum : 0.69 meter rise by 2100 3. 1 meter rise by 2100 4. 1.5 meter rise by 2100 5. 2 meter rise by 2100 Due to differing site conditions, local sea-level rise varies slightly from...
Investigations of coastal change and coastal resources often require continuous elevation profiles from the seafloor to coastal terrestrial landscapes. Differences in elevation data collection in the terrestrial and marine environments result in separate elevation products that may not share a vertical datum. This data release contains the assimilation of multiple elevation products into a continuous digital elevation model at a resolution of 3-arcseconds (approximately 90 meters) from the terrestrial landscape to the seafloor for the contiguous U.S., focused on the coastal interface. All datasets were converted to a consistent horizontal datum, the North American Datum of 1983, but the native vertical datum for...
Types: Map Service,
OGC WFS Layer,
OGC WMS Layer,
OGC WMS Service;
Tags: Bathymetry,
CMGP,
California,
Coastal and Marine Geology Program,
DEM,

In order to predict the impacts of climate change induced sea-level rise on Pacific Northwest coastal habitats, the Sea Level Affecting Marshes Model (SLAMM) was utilized to simulate future coastal habitat configurations under various sea-level rise scenarios. The model was run for 2025, 2050, 2075, and 2100. Historical or "initial condition" habitat classifications are also available for some sites. The sea-level rise scenarios include: 1. A1B greenhouse gas emission mean : 0.39 meter rise by 2100 2. A1B greenhouse gas emission maximum : 0.69 meter rise by 2100 3. 1 meter rise by 2100 4. 1.5 meter rise by 2100 5. 2 meter rise by 2100 Due to differing site conditions, local sea-level rise varies slightly from...

In order to predict the impacts of climate change induced sea-level rise on Pacific Northwest coastal habitats, the Sea Level Affecting Marshes Model (SLAMM) was utilized to simulate future coastal habitat configurations under various sea-level rise scenarios. The model was run for 2025, 2050, 2075, and 2100. Historical or "initial condition" habitat classifications are also available for some sites. The sea-level rise scenarios include: 1. A1B greenhouse gas emission mean : 0.39 meter rise by 2100 2. A1B greenhouse gas emission maximum : 0.69 meter rise by 2100 3. 1 meter rise by 2100 4. 1.5 meter rise by 2100 5. 2 meter rise by 2100 Due to differing site conditions, local sea-level rise varies slightly from...

In order to predict the impacts of climate change induced sea-level rise on Pacific Northwest coastal habitats, the Sea Level Affecting Marshes Model (SLAMM) was utilized to simulate future coastal habitat configurations under various sea-level rise scenarios. The model was run for 2025, 2050, 2075, and 2100. Historical or "initial condition" habitat classifications are also available for some sites. The sea-level rise scenarios include: 1. A1B greenhouse gas emission mean : 0.39 meter rise by 2100 2. A1B greenhouse gas emission maximum : 0.69 meter rise by 2100 3. 1 meter rise by 2100 4. 1.5 meter rise by 2100 5. 2 meter rise by 2100 Due to differing site conditions, local sea-level rise varies slightly from...
|

|
