Filters: Tags: Resistance (X)
233 results (41ms)|
Filters
Date Range
Extensions
Types Contacts
Categories Tag Types
|
A raster identifying previously burned areas as being 1) recovered (to sagebrush-dominant ecosystem), 2) recovering, or 3) transitioned to annual grass-dominated.
Categories: Data;
Types: ArcGIS REST Map Service,
ArcGIS Service Definition,
Downloadable,
Map Service;
Tags: Annual grass,
California,
Great Basin,
Idaho,
Montana,
This report provides a strategic approach developed by a Western Association of Fish and Wildlife Agencies interagency working group for conservation of sagebrush ecosystems, Greater sage-grouse, and Gunnison sage-grouse. It uses information on (1) factors that influence sagebrush ecosystem resilience to disturbance and resistance to nonnative invasive annual grasses and (2) distribution and relative abundance of sage-grouse populations to address persistent ecosystem threats, such as invasive annual grasses and wildfire, and land use and development threats, such as oil and gas development and cropland conversion, to develop effective management strategies. A sage-grouse habitat matrix links relative resilience...
Categories: Data;
Tags: Colorado,
Completed,
EARTH SCIENCE > LAND SURFACE > LANDSCAPE,
Federal resource managers,
GRSG,
This dataset is an extract of the resistance surface created for the Pacific Northwest Duke Climate Resilience Project. It incorporates data on various human activities from the following data sources: National Landcover Dataset, Energy Infrastructure data from the Ventyx Corporation, National Wetlands Inventory, TIGER 2010 Road Data, active railroads and Dave Theobald's housing density dataset developed from 2010 census data. More details on the creation of this surface can be found in the document "Creation of Resistance Surfaces for the Resistant Kernel Pacific Northwest Duke Landscape Resilience Project".
Categories: Data;
Types: Map Service,
OGC WFS Layer,
OGC WMS Layer,
OGC WMS Service;
Tags: ALI,
Arid Lands Initiative,
Columbia Plateau,
EARTH SCIENCE > LAND SURFACE > LANDSCAPE,
Eastern Washington,
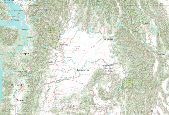
This GIS dataset is part of a suite of wildlife habitat connectivity data produced by the Washington Wildlife Habitat Connectivity Working Group (WHCWG). The WHCWG is a voluntary public-private partnership between state and federal agencies, universities, tribes, and non-governmental organizations. The WHCWG is co-led by the Washington Department of Fish and Wildlife (WDFW) and the Washington Department of Transportation (WSDOT). This dataset quantifies current wildlife habitat connectivity patterns for the Columbia Plateau Ecoregion in Washington, Oregon, and Idaho. Available WHCWG raster data include model base layers, resistance, habitat, cost-weighted distance, and landscape integrity. Grid cell size is 90 m...
This GIS dataset is part of a suite of wildlife habitat connectivity data produced by the Washington Wildlife Habitat Connectivity Working Group (WHCWG). The WHCWG is a voluntary public-private partnership between state and federal agencies, universities, tribes, and non-governmental organizations. The WHCWG is co-led by the Washington Department of Fish and Wildlife (WDFW) and the Washington Department of Transportation (WSDOT). This dataset quantifies current wildlife habitat connectivity patterns for the Columbia Plateau Ecoregion in Washington, Oregon, and Idaho. Available WHCWG raster data include model base layers, resistance, habitat, cost-weighted distance, and landscape integrity. Grid cell size is 90 m...
This GIS dataset is part of a suite of wildlife habitat connectivity data produced by the Washington Wildlife Habitat Connectivity Working Group (WHCWG). The WHCWG is a voluntary public-private partnership between state and federal agencies, universities, tribes, and non-governmental organizations. The WHCWG is co-led by the Washington Department of Fish and Wildlife (WDFW) and the Washington Department of Transportation (WSDOT). This dataset quantifies current wildlife habitat connectivity patterns for the Columbia Plateau Ecoregion in Washington, Oregon, and Idaho. Available WHCWG raster data include model base layers, resistance, habitat, cost-weighted distance, and landscape integrity. Grid cell size is 90 m...
This GIS dataset is part of a suite of wildlife habitat connectivity data produced by the Washington Wildlife Habitat Connectivity Working Group (WHCWG). The WHCWG is a voluntary public-private partnership between state and federal agencies, universities, tribes, and non-governmental organizations. The WHCWG is co-led by the Washington Department of Fish and Wildlife (WDFW) and the Washington Department of Transportation (WSDOT). The statewide analysis quantifies current connectivity patterns for Washington State and adjacent areas in British Columbia, Idaho, Oregon and a small portion of Montana. Available WHCWG raster data include model base layers, resistance, cost-weighted distance, landscape integrity networks,...
Categories: Data;
Types: Downloadable,
Map Service,
OGC WFS Layer,
OGC WMS Layer,
Shapefile;
Tags: core area,
cost-weighted distance,
focal species,
habitat concentration area,
least-cost corridor,
These datasets provide: 1) field-collected geotechnical data, and 2) Real-Time-Kinematic GPS elevation data for coastal salt marsh in the Port Sulphur area, Louisiana from 2019.

This GIS dataset is part of a suite of wildlife habitat connectivity data produced by the Washington Wildlife Habitat Connectivity Working Group (WHCWG). The WHCWG is a voluntary public-private partnership between state and federal agencies, universities, tribes, and non-governmental organizations. The WHCWG is co-led by the Washington Department of Fish and Wildlife (WDFW) and the Washington Department of Transportation (WSDOT). This dataset quantifies current wildlife habitat connectivity patterns for the Columbia Plateau Ecoregion in Washington, Oregon, and Idaho. Available WHCWG raster data include model base layers, resistance, habitat, cost-weighted distance, and landscape integrity. Grid cell size is 90 m...
Future climates are simulated by general circulation models (GCM) using climate change scenarios (IPCC 2014). To project climate change for the sagebrush biome, we used 11 GCMs and two climate change scenarios from the IPCC Fifth Assessment, representative concentration pathways (RCPs) 4.5 and 8.5 (Moss et al. 2010, Van Vuuren et al. 2011). RCP4.5 scenario represents a future where climate policies limit and achieve stabilization of greenhouse gas concentrations to 4.5 W m-2 by 2100. RCP8.5 scenario might be called a business-as-usual scenario, where high emissions of greenhouse gases continue in the absence of climate change policies. The two selected time frames allow comparison of near-term (2020-2050) and longer-term...
Categories: Data;
Types: Citation,
Downloadable,
GeoTIFF,
Map Service,
Raster;
Tags: Arizona,
CRS,
California,
Climate,
Colorado,
Raster layers identifying varying levels of priority for wildfire prevention, wildfire suppression and initial attack, and post-wildfire restoration efforts in the Great Basin

For a description of each map layer, select the Details tab, then select a Layer Name. This GIS dataset is part of a suite of wildlife habitat connectivity data produced by the Washington Wildlife Habitat Connectivity Working Group (WHCWG). The WHCWG is a voluntary public-private partnership between state and federal agencies, universities, tribes, and non-governmental organizations. The WHCWG is co-led by the Washington Department of Fish and Wildlife (WDFW) and the Washington Department of Transportation (WSDOT). This dataset quantifies current wildlife habitat connectivity patterns for the Columbia Plateau Ecoregion in Washington, Oregon, and Idaho. Available WHCWG raster data include model base layers, resistance,...
For a description of each map layer, select the Details tab, then select a Layer Name. This GIS dataset is part of a suite of wildlife habitat connectivity data produced by the Washington Wildlife Habitat Connectivity Working Group (WHCWG). The WHCWG is a voluntary public-private partnership between state and federal agencies, universities, tribes, and non-governmental organizations. The WHCWG is co-led by the Washington Department of Fish and Wildlife (WDFW) and the Washington Department of Transportation (WSDOT). This dataset quantifies current wildlife habitat connectivity patterns for the Columbia Plateau Ecoregion in Washington, Oregon, and Idaho. Available WHCWG raster data include model base layers, resistance,...
|

|
