Filters: Tags: Rhode Island (X)
717 results (74ms)|
Filters
Date Range
Extensions
Types
Contacts
Categories Tag Types
|
The Geographic Names Information System (GNIS) is the Federal standard for geographic nomenclature. The U.S. Geological Survey developed the GNIS for the U.S. Board on Geographic Names, a Federal inter-agency body chartered by public law to maintain uniform feature name usage throughout the Government and to promulgate standard names to the public. The GNIS is the official repository of domestic geographic names data; the official vehicle for geographic names use by all departments of the Federal Government; and the source for applying geographic names to Federal electronic and printed products of all types.
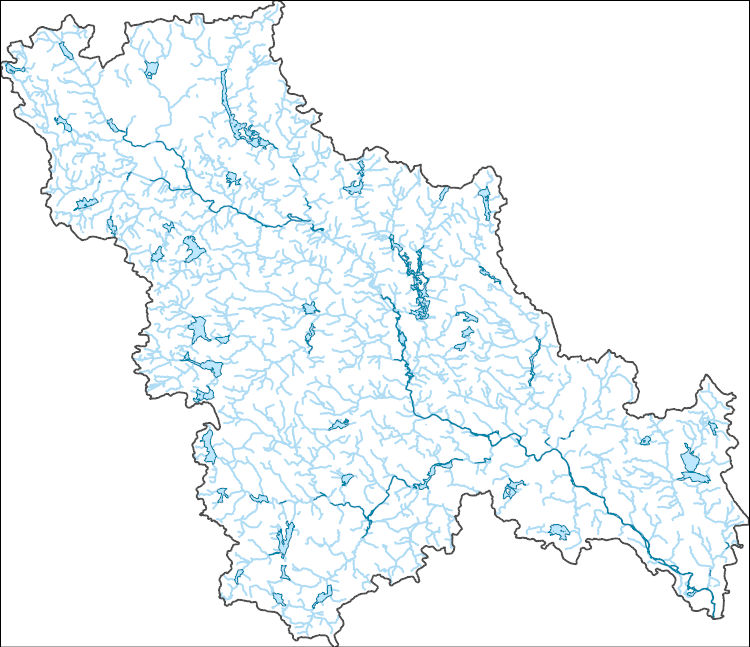
The National Hydrography Dataset (NHD) is a feature-based database that interconnects and uniquely identifies the stream segments or reaches that make up the nation's surface water drainage system. NHD data was originally developed at 1:100,000-scale and exists at that scale for the whole country. This high-resolution NHD, generally developed at 1:24,000/1:12,000 scale, adds detail to the original 1:100,000-scale NHD. (Data for Alaska, Puerto Rico and the Virgin Islands was developed at high-resolution, not 1:100,000 scale.) Local resolution NHD is being developed where partners and data exist. The NHD contains reach codes for networked features, flow direction, names, and centerline representations for areal water...
Air view, looking southwest, west-central portion of the Hope Valley quadrangle. Intersection of Plain Road and a north-south road at the lower right. Reflection from water, lower center, is the Wood River. Rhode Island. November 1957.
Categories: Image;
Types: Map Service,
OGC WFS Layer,
OGC WMS Layer,
OGC WMS Service;
Tags: Feininger, T.G. Collection,
Photographers,
Rhode Island,
photo print
This EnviroAtlas web service supports research and online mapping activities related to EnviroAtlas (https://www.epa.gov/enviroatlas). The Clean and Plentiful Water category in this web service includes layers illustrating the ecosystems and natural resources that filter and regulate water, the need or demand for clean and plentiful water, the impacts associated with water quality, and factors that place stress on water quality and supply. EnviroAtlas allows the user to interact with a web-based, easy-to-use, mapping application to view and analyze multiple ecosystem services for the conterminous United States. Additional descriptive information about each attribute in this web service is located within each web...
This child item describes Python code used to estimate average yearly and monthly tourism per 1000 residents within public-supply water service areas. Increases in population due to tourism may impact amounts of water used by public-supply water systems. This data release contains model input datasets, Python code used to develop the tourism information, and output estimates of tourism. This dataset is part of a larger data release using machine learning to predict public supply water use for 12-digit hydrologic units from 2000-2020. Output from this code was used as an input feature in the public supply delivery and water use machine learning models. This page includes the following files: tourism_input_data.zip...
This child item describes a public supply delivery machine learning model that was developed to estimate public-supply deliveries. Publicly supplied water may be delivered to domestic users or to commercial, industrial, institutional, and irrigation (CII) users. This model predicts total, domestic, and CII per capita rates for public-supply water service areas within the conterminous United States for 2009-2020. This child item contains model input datasets, code used to build the delivery machine learning model, and national predictions. This dataset is part of a larger data release using machine learning to predict public-supply water use for 12-digit hydrologic units from 2000-2020. This page includes the following...
This child item describes Python code used to query census data from the TigerWeb Representational State Transfer (REST) services and the U.S. Census Bureau Application Programming Interface (API). These data were needed as input feature variables for a machine learning model to predict public supply water use for the conterminous United States. Census data were retrieved for public-supply water service areas, but the census data collector could be used to retrieve data for other areas of interest. This dataset is part of a larger data release using machine learning to predict public supply water use for 12-digit hydrologic units from 2000-2020. Data retrieved by the census data collector code were used as input...
This map layer shows major ports in the United States, Puerto Rico, and the U.S. Virgin Islands. A port is a city, town, or urban area with a harbor where ships load or unload. This is a revised version of the July 2012 map layer.
Categories: Data;
Types: Downloadable,
Map Service,
OGC WFS Layer,
OGC WMS Layer,
Shapefile;
Tags: Academics & scientific researchers,
Alabama,
Arizona,
Arkansas,
California,
This data set represents the extent, approximate location and type of wetlands and deepwater habitats in the United States and its Territories. These data delineate the areal extent of wetlands and surface waters as defined by Cowardin et al. (1979). Certain wetland habitats are excluded from the National mapping program because of the limitations of aerial imagery as the primary data source used to detect wetlands. These habitats include seagrasses or submerged aquatic vegetation that are found in the intertidal and subtidal zones of estuaries and near shore coastal waters. Some deepwater reef communities (coral or tuberficid worm reefs) have also been excluded from the inventory. These habitats, because of their...
Categories: Data;
Types: Map Service,
OGC WFS Layer,
OGC WMS Layer,
OGC WMS Service;
Tags: Academics & scientific researchers,
Alabama,
Alabama,
Alaska,
Arizona,
This data release contains input data used in model development and TIF raster files used to predict the probability of high arsenic (As) and high manganese (Mn) in groundwater within the glacial aquifer system in the northern United States. Input data include measured As and Mn concentrations at groundwater wells, and associated predictor variable data. The probability of high As and high Mn was predicted using boosted regression tree methods using the gbm package in R version 4.0.0. The response variables for individual models were the occurrence of: (1) As >10 µg/L, and (2) Mn >300 µg/L. Water-quality data were compiled from three sources, as described in Wilson and others (2019): a compilation of data from numerous...
This dataset represents the connections between each nearby pair of 2080 cores for American woodcock. It is intended to highlight areas important for connecting cores and to visually represent the connections among refugia cores.
Categories: Data;
Types: Downloadable,
GeoTIFF,
Map Service,
Raster;
Tags: Connecticut,
Delaware,
District of Columbia,
Maine,
Maryland,
This dataset represents the connections between each nearby pair of 2020 cores for Blackburnian warbler. It is intended to highlight areas important for connecting cores and to visually represent the connections among cores.
Categories: Data;
Types: Downloadable,
GeoTIFF,
Map Service,
Raster;
Tags: Connecticut,
Delaware,
District of Columbia,
Maine,
Maryland,
Measures used to assess trends in the 10th, 50th, and 90th quantiles of annual peak streamflow from 1916-2015 at 2,683 U.S. Geological Survey stations and within 191 4-digit HUCs in the conterminous United States. Linear quantile regression was applied to the selected quantiles of log-transformed annual peak streamflow to represent trends for a range of flood frequencies from small, common floods to large, infrequent floods. Comparative trends in pairs of quantiles were characterized as coherent, convergent, or divergent by comparing the slopes of linear quantile regression equations.
Daily lake surface temperatures estimates for 185,549 lakes across the contiguous United States from 1980 to 2020 generated using an entity-aware long short-term memory deep learning model. In-situ measurements used for model training and evaluation are from 12,227 lakes and are included as well as daily meteorological conditions and lake properties. Median per-lake estimated error found through cross validation on lakes with in-situ surface temperature observations was 1.24 °C. The generated dataset will be beneficial for a wide range of applications including estimations of thermal habitats and the impacts of climate change on inland lakes.
This dataset presents the total estimated monthly public-supply water withdrawal by 12-digit hydrologic unit code (HUC12) in the conterminous United States for 2015. Public-supply water use was estimated by spatially and temporally downscaling available data from each state. The total represents combined groundwater and surface water withdrawals for 83,178 watersheds. Public supply refers to water withdrawn by public and private water suppliers that provide water for cities, towns, rural water districts, mobile-home parks, Native American Indian reservations, and military bases. Public-supply facilities are classified under the Standard Industrial Classification (SIC) 4941 and provide water to at least 25 people...
This dataset represents public and non-governmental organizations (NGO) beaches in the North and Mid-Atlantic. The data are part of a larger project, Inventory of Habitat Modifications to Sandy Oceanfront Beaches in the U.S. Atlantic Coast Breeding Range of the Piping Plover (Charadrius melodus) as of 2015: Maine to North Carolina. Beachfront land parcels in public or NGO ownership were delineated from a variety of sources, including county or municipal parcel data available online to the public (see Table 1 of Rice 2015b for a full list of sources consulted for Maine to New York). Public and NGO-owned beachfront parcels are delineated with narrow, lime green lines in Google Earth Pro. The public / NGO line segments...
Categories: Data;
Types: ArcGIS REST Map Service,
ArcGIS Service Definition,
Downloadable,
Map Service;
Tags: Connecticut,
Delaware,
Long Island Sound,
Maine,
Maryland,
This EnviroAtlas web service supports research and online mapping activities related to EnviroAtlas (https://www.epa.gov/enviroatlas). The Food, Fuel, and Materials category in this web service includes layers illustrating the ecosystems and natural resources that provide or support the production of food, fuel, or other materials, the need or demand for these items, the impacts associated with their presence and accessibility, and factors that place stress on the natural environment's capability to provide these benefits. EnviroAtlas allows the user to interact with a web-based, easy-to-use, mapping application to view and analyze multiple ecosystem services for the conterminous United States. Additional descriptive...
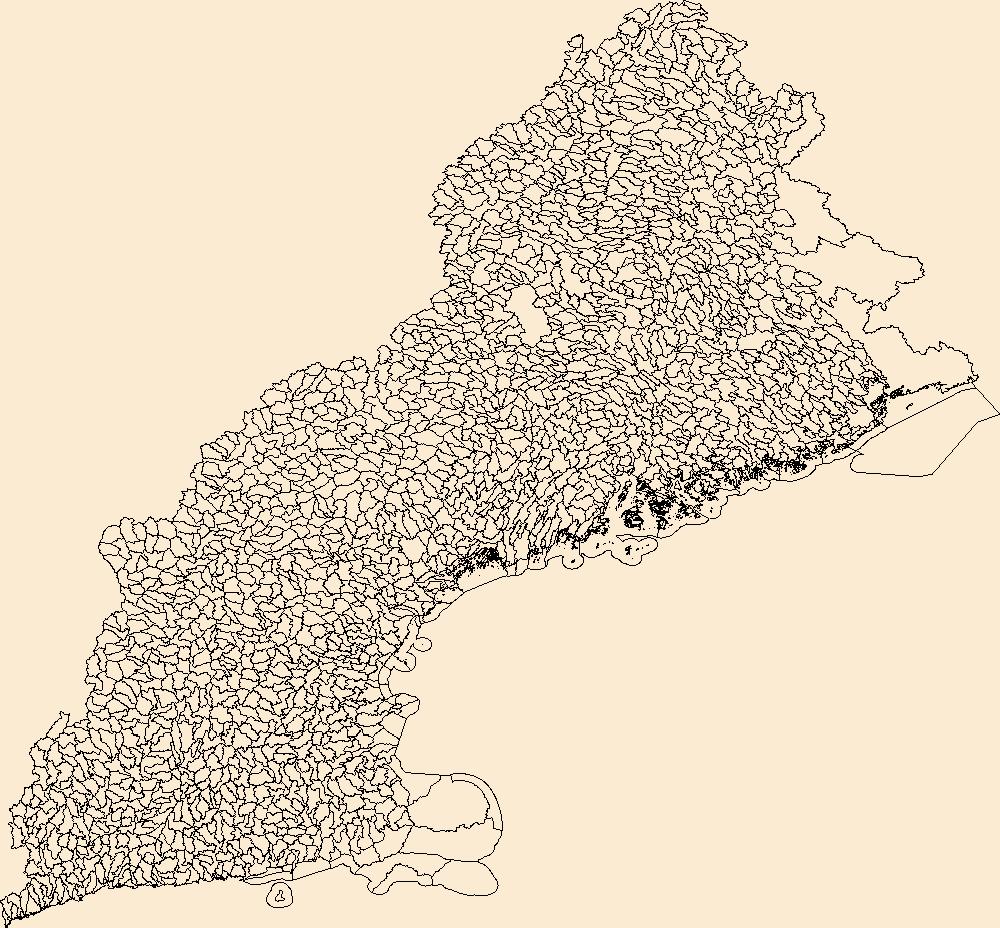
The Watershed Boundary Dataset (WBD) is a comprehensive aggregated collection of hydrologic unit data consistent with the national criteria for delineation and resolution. It defines the areal extent of surface water drainage to a point except in coastal or lake front areas where there could be multiple outlets as stated by the "Federal Standards and Procedures for the National Watershed Boundary Dataset (WBD)" "Standard" (https://pubs.usgs.gov/tm/11/a3/). Watershed boundaries are determined solely upon science-based hydrologic principles, not favoring any administrative boundaries or special projects, nor particular program or agency. This dataset represents the hydrologic unit boundaries to the 12-digit (6th level)...
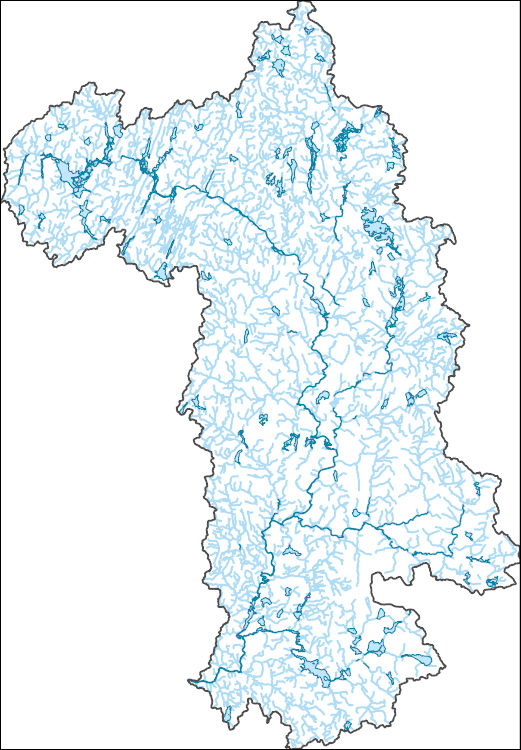
The download for this dataset includes TNC’s full Northeastern Aquatic Habitat Classification System: stream size, stream temperature, stream gradient, stream geology, lakes and catchments. This dataset represents the results (9/30/2008) of the Northeastern Aquatic Habitat Classification System (NAHCS) GIS map for streams and rivers. This classification focused on mapping a stream habitat types across 13 northeastern states (ME, NH, VT, MA, CT, RI, NY, NJ, PA, MD, DC, DE, VA, WV). Stream and river centerlines were extracted from the USGS National Hydrography Dataset Plus (NH-Plus) 2006 1:100,000 data. These reaches were attributed and placed into classes representing their biopysical setting in terms of stream...
Categories: Data;
Types: ArcGIS REST Map Service,
ArcGIS Service Definition,
Downloadable,
Map Service;
Tags: Connecticut,
Connecticut,
Data,
Delaware,
Delaware,
The National Hydrography Dataset (NHD) is a feature-based database that interconnects and uniquely identifies the stream segments or reaches that make up the nation's surface water drainage system. NHD data was originally developed at 1:100,000-scale and exists at that scale for the whole country. This high-resolution NHD, generally developed at 1:24,000/1:12,000 scale, adds detail to the original 1:100,000-scale NHD. (Data for Alaska, Puerto Rico and the Virgin Islands was developed at high-resolution, not 1:100,000 scale.) Local resolution NHD is being developed where partners and data exist. The NHD contains reach codes for networked features, flow direction, names, and centerline representations for areal water...
|

|
