Filters: Tags: Rhode Island (X)
719 results (119ms)|
Filters
Date Range
Extensions
Types
Contacts
Categories Tag Types
|
A one-year seismic hazard forecast for the Central and Eastern United States, based on induced and natural earthquakes, has been produced by the U.S. Geological Survey. The model assumes that earthquake rates calculated from several different time windows will remain relatively stationary and can be used to forecast earthquake hazard and damage intensity for the year 2016. This assessment is the first step in developing an operational earthquake forecast for the CEUS, and the analysis could be revised with updated seismicity and model parameters. Consensus input models consider alternative earthquake catalog durations, smoothing parameters, maximum magnitudes, and ground motion estimates, and represent uncertainties...
Categories: Data;
Types: Downloadable,
Map Service,
OGC WFS Layer,
OGC WMS Layer,
Shapefile;
Tags: Alabama,
Arizona,
Arkansas,
Colorado,
Connecticut,
This shapefile contains landscape factors representing human disturbances summarized to local and network catchments of river reaches for the Eastern Brook Trout Joint Venture. This dataset is the result of clipping the feature class 'NFHAP 2010 HCI Scores and Human Disturbance Data for the Conterminous United States linked to NHDPLUSV1.gdb' to the boundary of the Eastern Brook Trout Joint Venture. Landscape factors include land uses, population density, roads, dams, mines, and point-source pollution sites. The source datasets that were compiled and attributed to catchments were identified as being: (1) meaningful for assessing fish habitat; (2) consistent across the entire study area in the way that they were assembled;...
Categories: Data;
Types: ArcGIS REST Map Service,
Downloadable,
Map Service,
OGC WFS Layer,
OGC WMS Layer,
Shapefile;
Tags: Anthropogenic factors,
Aquatic habitats,
Atlantic Coast FHP,
Catchment areas,
Connecticut,
This shapefile contains landscape factors representing human disturbances summarized to local and network catchments of river reaches for the state of Maine. This dataset is the result of clipping the feature class 'NFHAP 2010 HCI Scores and Human Disturbance Data for the Conterminous United States linked to NHDPLUSV1.gdb' to the state boundary of Maine. Landscape factors include land uses, population density, roads, dams, mines, and point-source pollution sites. The source datasets that were compiled and attributed to catchments were identified as being: (1) meaningful for assessing fish habitat; (2) consistent across the entire study area in the way that they were assembled; (3) representative of conditions in...
Categories: Data;
Types: ArcGIS REST Map Service,
Downloadable,
Map Service,
OGC WFS Layer,
OGC WMS Layer,
Shapefile;
Tags: Anthropogenic factors,
Aquatic habitats,
Atlantic Coast FHP,
Catchment areas,
Connecticut,
Layers of geospatial data include contours, boundaries, land cover, hydrography, roads, transportation, geographic names, structures, and other selected map features.
Types: Citation;
Tags: 7.5 x 7.5 minute,
7.5 x 7.5 minute,
Bristol County,
Bristol County,
Combined Vector,
This shapefile contains landscape factors representing human disturbances summarized to local and network catchments of river reaches for the state of Arkansas. This dataset is the result of clipping the feature class 'NFHAP 2010 HCI Scores and Human Disturbance Data for the Conterminous United States linked to NHDPLUSV1.gdb' to the state boundary of Arkansas. Landscape factors include land uses, population density, roads, dams, mines, and point-source pollution sites. The source datasets that were compiled and attributed to catchments were identified as being: (1) meaningful for assessing fish habitat; (2) consistent across the entire study area in the way that they were assembled; (3) representative of conditions...
Categories: Data;
Types: ArcGIS REST Map Service,
Downloadable,
Map Service,
OGC WFS Layer,
OGC WMS Layer,
Shapefile;
Tags: Anthropogenic factors,
Aquatic habitats,
Atlantic Coast FHP,
Catchment areas,
Connecticut,
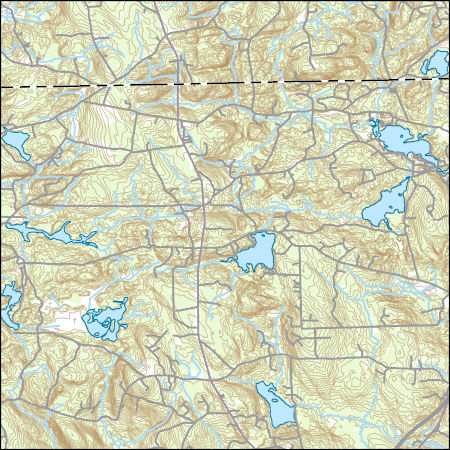
Layers of geospatial data include contours, boundaries, land cover, hydrography, roads, transportation, geographic names, structures, and other selected map features.
Types: Citation;
Tags: 7.5 x 7.5 minute,
7.5 x 7.5 minute,
Combined Vector,
Combined Vector,
Combined Vector,
This shapefile contains landscape factors representing human disturbances summarized to local and network catchments of river reaches for the state of Indiana. This dataset is the result of clipping the feature class 'NFHAP 2010 HCI Scores and Human Disturbance Data for the Conterminous United States linked to NHDPLUSV1.gdb' to the state boundary of Indiana. Landscape factors include land uses, population density, roads, dams, mines, and point-source pollution sites. The source datasets that were compiled and attributed to catchments were identified as being: (1) meaningful for assessing fish habitat; (2) consistent across the entire study area in the way that they were assembled; (3) representative of conditions...
Categories: Data;
Types: ArcGIS REST Map Service,
Downloadable,
Map Service,
OGC WFS Layer,
OGC WMS Layer,
Shapefile;
Tags: Anthropogenic factors,
Aquatic habitats,
Atlantic Coast FHP,
Catchment areas,
Connecticut,
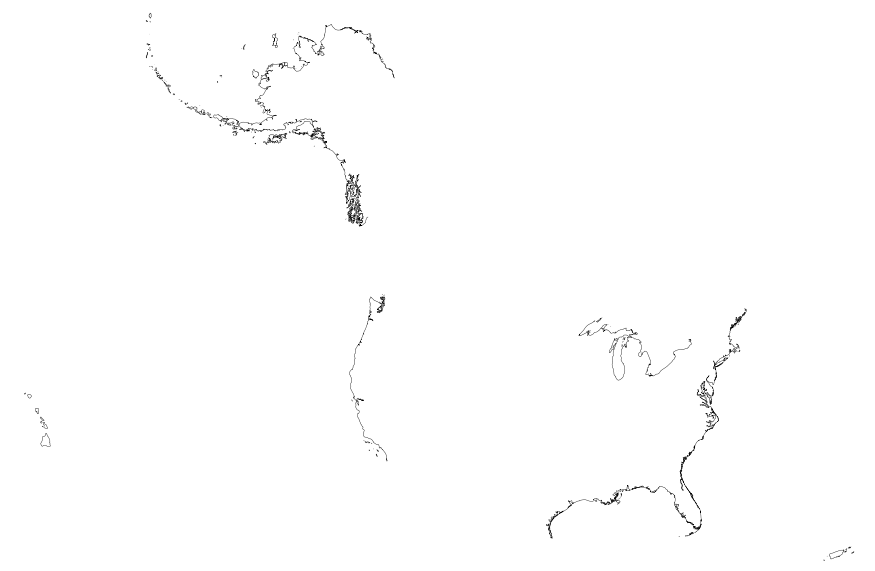
This map layer includes Global Map data showing the coastline of the United States, Puerto Rico, and the U.S. Virgin Islands. The United States shoreline of the Great Lakes is also included. The data are a modified version of the National Atlas of the United States 1:1,000,000-Scale Coastline of the United States.

This map layer portrays the coastline of the United States, Puerto Rico, and the U.S. Virgin Islands. The United States shoreline of the Great Lakes is also included. This is a revised version of the July 2012 map layer.
Layers of geospatial data include contours, boundaries, land cover, hydrography, roads, transportation, geographic names, structures, and other selected map features.
Types: Citation;
Tags: 7.5 x 7.5 minute,
7.5 x 7.5 minute,
Combined Vector,
Combined Vector,
Combined Vector,
Understanding how sea-level rise will affect coastal landforms and the species and habitats they support is critical for crafting approaches that balance the needs of humans and native species. Given this increasing need to forecast sea-level rise effects on barrier islands in the near and long terms, we are developing Bayesian networks to evaluate and to forecast the cascading effects of sea-level rise on shoreline change, barrier island state, and piping plover habitat availability. We use publicly available data products, such as lidar, orthophotography, and geomorphic feature sets derived from those, to extract metrics of barrier island characteristics at consistent sampling distances. The metrics are then incorporated...
Categories: Data;
Types: Downloadable,
GeoTIFF,
Map Service,
Raster;
Tags: Atlantic Ocean,
Barrier Island,
Bayesian Network,
CMGP,
Charadrius melodus,
Human impacts occurring throughout the Northeast and Midwest United States, including urbanization, agriculture, and dams, have multiple effects on the region’s streams which support economically valuable stream fishes. Changes in climate are expected to lead to additional impacts in stream habitats and fish assemblages in multiple ways, including changing stream water temperatures. To manage streams for current impacts and future changes, managers need region-wide information for decision-making and developing proactive management strategies. Our project met that need by integrating results of a current condition assessment of stream habitats based on fish response to human land use, water quality impairment,...
Categories: Data;
Types: Citation;
Tags: Aquatic Biology,
Aquatic habitats,
Connecticut,
Data Visualization & Tools,
Delaware,
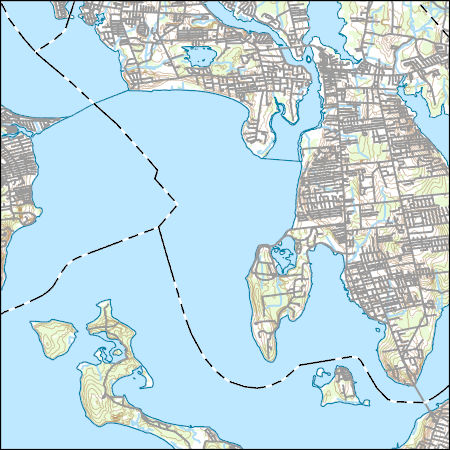
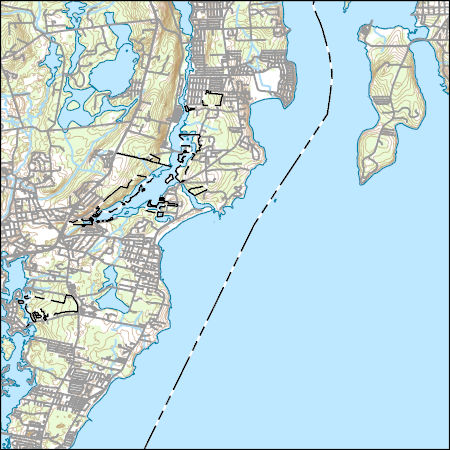
Layered GeoPDF 7.5 Minute Quadrangle Map. Layers of geospatial data include orthoimagery, roads, grids, geographic names, elevation contours, hydrography, and other selected map features.
Layered GeoPDF 7.5 Minute Quadrangle Map. Layers of geospatial data include orthoimagery, roads, grids, geographic names, elevation contours, hydrography, and other selected map features.
Layered GeoPDF 7.5 Minute Quadrangle Map. Layers of geospatial data include orthoimagery, roads, grids, geographic names, elevation contours, hydrography, and other selected map features.
Layered GeoPDF 7.5 Minute Quadrangle Map. Layers of geospatial data include orthoimagery, roads, grids, geographic names, elevation contours, hydrography, and other selected map features.
Layered GeoPDF 7.5 Minute Quadrangle Map. Layers of geospatial data include orthoimagery, roads, grids, geographic names, elevation contours, hydrography, and other selected map features.
Layered GeoPDF 7.5 Minute Quadrangle Map. Layers of geospatial data include orthoimagery, roads, grids, geographic names, elevation contours, hydrography, and other selected map features.
Layered geospatial PDF 7.5 Minute Quadrangle Map. Layers of geospatial data include orthoimagery, roads, grids, geographic names, elevation contours, hydrography, and other selected map features. This map is derived from GIS (geospatial information system) data. It represents a repackaging of GIS data in traditional map form, not creation of new information. The geospatial data in this map are from selected National Map data holdings and other government sources.
Layered geospatial PDF 7.5 Minute Quadrangle Map. Layers of geospatial data include orthoimagery, roads, grids, geographic names, elevation contours, hydrography, and other selected map features. This map is derived from GIS (geospatial information system) data. It represents a repackaging of GIS data in traditional map form, not creation of new information. The geospatial data in this map are from selected National Map data holdings and other government sources.
|

|
