Filters: Tags: SARP (X)
56 results (61ms)|
Filters
Date Range
Extensions Types
Contacts
Categories Tag Types
|

The SARP Riparian Assessment analysis assesses the current condition of riparian habitat within a 30 meter buffers along streams and rivers throughout the SARP region and provides a baseline against which to measure future progress toward achieving riparian habitat conservation/restoration goals. For more information, read the Riparian Assessment White Paper: http://southeastaquatics.net/documents/riparian-assessment-white-paper

The SARP River Classification Framework provides consistent categories of ecologically relevant attributes for streams and rivers across the region at the NHD+ segment scale. The attributes that are currently available include: 1) stream size: by basin area and mean annual flow; 2) gradient: by average segment slope; 3) EPA Level 3 Ecoregion; 4) TNC Freshwater Ecoregion; and 5) Ecological Drainage Units.  For more detailed information, go to the SIFN page on the SARP website at http://www.southeastaquatics.net/sarps-programs/sifn

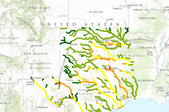
The SARP Flow Alteration Assessment provides a regional characterization of the distribution and risk of flow regime impairment of streams and rivers by anthropogenic sources at the NHD+ segment scale. This map illustrates the local risk of flow alteration (RFA) from surface water use by water use sector for Texas and Oklahoma.  Water use is based on state permits for surface water withdrawals and returns.  The risk is based on the volume of water used monthly in the drainage area relative to the monthly volume of flow.  Risk of Flow Alteration categories:  ZERO     - 0% mean monthly flow depletion,  LOW      - > 0-10%,  MEDIUM - > 10-20%,  HIGH      - >20-100%, and  PROVISIONAL...

The SARP Flow Alteration Assessment provides a regional characterization of the distribution and risk of flow regime impairment of streams and rivers by anthropogenic sources at the NHD+ segment scale. This map illustrates the risk of flow alteration (RFA) due to evaporative loss from artificial water bodies in local catchments for the 14-state SARP region. Â The amount of water body surface is based on high resolution NHD and linked to NHD+ catchments. Â The risk is based on the percentage of the catchment land surface covered by artificial water bodies (100 x water body surface area / watershed surface area) Risk of flow alteration categories: Â Â Â Â Â Â Â Â Â ZERO -Â Â Â Â Â Â 0% land covered by artificial...

Ecologically relevant river slope classes for NHDPlus v1 flowlines in the 14 state SARP region.  Slope was derived from the NHDPlus v1 dataset. For more information about how this attribute was developed by the Southern Instream Flow Network (SIFN), go to http://www.southeastaquatics.net/sarps-programs/sifn/instream-flow-resourcesYour comments about this dataset are welcome. Please send comments to the dataset author using the Comment tab below.Â
The SARP Flow Alteration Assessment provides a regional characterization of the distribution and risk of flow regime impairment of streams and rivers by anthropogenic sources at the NHD+ segment scale. This map illustrates the cumulative risk of flow alteration (RFA) from surface water use for mining in Texas and Oklahoma.  Water use is based on state permits for surface water withdrawals and returns.  The risk is based on the volume of water used monthly in the drainage area relative to the monthly volume of flow.  Risk of Flow Alteration categories:  ZERO     - 0% mean monthly flow depletion,  LOW      - > 0-10%,  MEDIUM - > 10-20%,  HIGH      - >20-100%, and  PROVISIONAL...

The SARP Flow Alteration Assessment provides a regional characterization of the distribution and risk of flow regime impairment of streams and rivers by anthropogenic sources at the NHD+ segment scale. This map illustrates the cumulative risk of flow alteration (RFA) from surface water use for domestic and livestock in Texas and Oklahoma.  Water use is based on state permits for surface water withdrawals and returns.  The risk is based on the volume of water used monthly in the drainage area relative to the monthly volume of flow.  Risk of Flow Alteration categories:  ZERO     - 0% mean monthly flow depletion,  LOW      - > 0-10%,  MEDIUM - > 10-20%,  HIGH      - >20-100%,...

The SARP Riparian Assessment analysis assesses the current condition of riparian habitat within a 30 meter buffers along streams and rivers throughout the SARP region and provides a baseline against which to measure future progress toward achieving riparian habitat conservation/restoration goals. For more information, read the Riparian Assessment White Paper: http://southeastaquatics.net/documents/riparian-assessment-white-paper

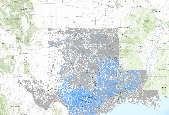
Total Surface water withdrawals by County in 2005, in Mgal/d

Boundaries of the Aquatic Conservation Focus Areas selected by the Southeast Aquatic Resources Partnership (SARP) for the FY2014 Request for Proposals for restoration projects. Â Â Conservation Focus Areas were approved by the SARP Steering Committee.For more information, go to the SARP website at www.southeastaquatics.net..

The SARP Riparian Assessment analysis assesses the current condition of riparian habitat within a 30 meter buffers along streams and rivers throughout the SARP region and provides a baseline against which to measure future progress toward achieving riparian habitat conservation/restoration goals. For more information, read the Riparian Assessment White Paper: http://southeastaquatics.net/documents/riparian-assessment-white-paper

The SARP Flow Alteration Assessment provides a regional characterization of the distribution and risk of flow regime impairment of streams and rivers by anthropogenic sources at the NHD+ segment scale. This map illustrates the risk of flow alteration (RFA) from runoff from impervious surfaces in local catchments for the 14-state SARP region.  The amount of impervious surface is based on 2006 National Land Use/Land Cover dataset.  The risk is based on the percentage of the catchment land surface covered by impervious surfaces (100 x impervious surface area / watershed surface area: Risk of flow alteration categories:         ZERO -     0% land covered by impervious surface         LOW -Â...
Note:  The contents of this map are still under development and are being made available for illustration purposes only.  These data are not to be used without permission by the map author.Potential Distribution of Guadalupe bass (Micropterus treculii)in Texas, Oklahoma, and Louisiana.  NHDplus segments are coded for the likelihood of the Guadalupe bass being present. The likelihood is based on the SARP river size class and Omernik Ecoregion Level III where this fish was found by state fish community sampling efforts. The fish sampling data can be downloaded from the Multistate Aquatic Resources Information System (www.marisdata.org). This fish species is thought to be sensitive to alterations in the flow...
The SARP Flow Alteration Assessment provides a regional characterization of the distribution and risk of flow regime impairment of streams and rivers by anthropogenic sources at the NHD+ segment scale. This map illustrates the cumulative risk of flow alteration (RFA) from surface water use by water use sector for Texas and Oklahoma.  Water use is based on state permits for surface water withdrawals and returns.  The risk is based on the volume of water used monthly in the drainage area relative to the monthly volume of flow.Risk of Flow Alteration categories: ZERO     - 0% mean monthly flow depletion,  LOW      - > 0-10%,  MEDIUM - > 10-20%,  HIGH      - >20-100%, and PROVISIONAL...

The SARP Flow Alteration Assessment provides a regional characterization of the distribution and risk of flow regime impairment of streams and rivers by anthropogenic sources at the NHD+ segment scale. This map illustrates the cumulative risk of flow alteration (RFA) from surface water use for municipalities in Texas and Oklahoma.  Water use is based on state permits for surface water withdrawals and returns.  The risk is based on the volume of water used monthly in the drainage area relative to the monthly volume of flow.  Risk of Flow Alteration categories:  ZERO     - 0% mean monthly flow depletion,  LOW      - > 0-10%,  MEDIUM - > 10-20%,  HIGH      - >20-100%, and  PROVISIONAL...

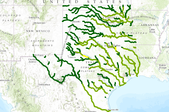
The SARP Riparian Assessment analysis assesses the condition of riparian habitat within a 30 m buffer along streams and rivers throughout the SARP region and provide a baseline against which to measure future progress toward achieving riparian habitat conservation/restoration goals.The 1:24,000 National Hydrography Dataset (NHD) was used to represent the perennial streams and rivers in the SARP region. A 30 meter buffer was generated around each reach in the NHD. Tabulations of each land cover class in the 2001 National Land Cover Dataset (NLCD) found within the riparian buffer were used to calculate the percentage of disturbed riparian land cover for each river segment. Disturbed riparian land cover was defined...

Ecoregions of the SARP region based on Omernik (1987) attributed to NHDplus catchments. Ecoregions are areas with generally similar ecosystems and similar types, qualities, and quantities of environmental resources,. Ecoregion boundaries were determined by examining patterns of vegetation, animal life, geology, soils, water quality, climate, and human land use, as well as other living and non-living ecosystem components. Level III ecoregions are delineated for regional analysis and decision-making. For more information about this attribute, visit  http://www.epa.gov/wed/pages/ecoregions.htm and http://nationalatlas.gov/mld/ecoomrp.html.

The SARP Riparian Assessment analysis assesses the current condition of riparian habitat within a 30 meter buffers along streams and rivers throughout the SARP region and provides a baseline against which to measure future progress toward achieving riparian habitat conservation/restoration goals. For more information, read the Riparian Assessment White Paper: http://southeastaquatics.net/documents/riparian-assessment-white-paper

Note:  The contents of this map are still under development and are being made available for illustration purposes only.  These data are not to be used without permission by the map author.Potential distribution of Alligator gar (Atractosteus spatula) in Texas, Oklahoma, and Louisiana.  NHDplus segments are coded for the likelihood of the Alligator gar being present. The likelihood is based on the SARP river size class and Omernik Ecoregion Level III where this fish was found by state fish community sampling efforts. The fish sampling data can be downloaded from the Multistate Aquatic Resources Information System (www.marisdata.org). This fish species is thought to be sensitive to alterations in the flow...

The SARP Flow Alteration Assessment provides a regional characterization of the distribution and risk of flow regime impairment of streams and rivers by anthropogenic sources at the NHD+ segment scale. This map illustrates the cumulative risk of flow alteration (RFA) from surface water use for irrigation in Texas and Oklahoma.  Water use is based on state permits for surface water withdrawals and returns.  The risk is based on the volume of water used monthly in the drainage area relative to the monthly volume of flow.  Risk of Flow Alteration categories:  ZERO     - 0% mean monthly flow depletion,  LOW      - > 0-10%,  MEDIUM - > 10-20%,  HIGH      - >20-100%, and  PROVISIONAL...
|

|
