Filters: Tags: SPARROW (X)
262 results (72ms)|
Filters
Date Range
Extensions Types
Contacts
Categories Tag Types Tag Schemes |
This tabular data set represents the presence of six National Hydrography Dataset (NHD) high resolution waterbody types compiled for two spatial components of the NHDPlus version 2 data suite (NHDPlusv2) for the conterminous United States; 1) individual reach catchments and 2) reach catchments accumulated upstream through the river network. The six types of waterbodies presented here are: playa, ice mass, lake/pond, reservoir, swamp/marsh, and estuary. This dataset can be linked to the NHDPlus version 2 data suite by the unique identifier COMID. The source data is the NHDPlus high resolution waterbodies produced by USGS , 2015. Units are percent. Reach catchment information characterizes data at the local scale....
Types: Citation;
Tags: Catchment,
Conterminous United States,
Inlandwaters,
NAWQA,
NHD high resolution waterbodies,
This tabular data set represents 30 year average (1961-1990) of maximum monthly number of days of measurable precipitation per month compiled for two spatial components of the NHDPlus version 2 data suite (NHDPlusv2) for the conterminous United States; 1) individual reach catchments and 2) reach catchments accumulated upstream through the river network. This dataset can be linked to the NHDPlus version 2 data suite by the unique identifier COMID. The source data for 30 year average (1961-1990) of maximum monthly number of days of measurable precipitation was originally PRISM-based data, with some further enhancements by ClimateSource.com and then provided to the USGS by the Environmental Protection Agency (Ryan...
This tabular data set represents mean-annual actual evapotranspiration, estimated using the regression equation of Sanford and Selnick (2013) compiled for two spatial components of the NHDPlus version 2 data suite (NHDPlusv2) for the conterminous United States; 1) individual reach catchments and 2) reach catchments accumulated upstream through the river network. This dataset can be linked to the NHDPlus version 2 data suite by the unique identifier COMID. The source data for mean-annual actual evapotranspiration was produced by the USGS (Sanford and others, 2013) using the regression equation of Sanford and Selnick (2013). Units are millimeters per year. Reach catchment information characterizes data at the local...
This tabular data set represents NLCD 2006 percent imperviousness compiled for two spatial components of the NHDPlus version 2 data suite (NHDPlusv2) for the conterminous United States; 1) individual reach catchments and 2) reach catchments accumulated upstream through the river network. This dataset can be linked to the NHDPlus version 2 data suite by the unique identifier COMID. The source data is the "NLCD 2006 Percent Developed Imperviousness (2011 Edition, amended 2014) - National Geospatial Data Asset (NGDA) Land Use Land Cover" which was produced by the United States Geological Survey (Yang and others, 2011). Units are percent. Reach catchment information characterizes data at the local scale. Reach catchments...
This tabular data set represents annual average actual evapotranspiration values (millimeters) described in Wolock and McCabe (2017), compiled for the NHDPlus version 2 data suite (NHDPlusV2) for the conterminous United States for the years 2014 and 2015. Linkage of the actual evapotranspiration data with NHDPlusV2 is achieved through the common unique identifier COMID. The actual evapotranspiration values are estimated both for: 1) individual reach catchments and 2) reach catchments accumulated upstream through the river network. The reach catchment information characterizes data at the local scale, whereas the catchments accumulated through the river network characterize cumulative upstream conditions. The network-accumulated...
This tabular data set represents contact time, the length of time it takes for water to drain along subsurface flow paths to the stream, compiled for two spatial components of the NHDPlus version 2 data suite (NHDPlusv2) for the conterminous United States; 1) individual reach catchments and 2) reach catchments accumulated upstream through the river network. This dataset can be linked to the NHDPlus version 2 data suite by the unique identifier COMID. The source data for contact time was produced by Dave Wolock, (USGS, written communication, 2014) and based on the methods outlined in Wolock and others (1997). Units are days. Contact time is computed from basin topography, soil porosity, and soil hydraulic conductivity....
This tabular data set represents 30 year (1971 - 2000) mean annual temperature (Celsius) compiled for two spatial components of the NHDPlus version 2 data suite (NHDPlusv2) for the conterminous United States; 1) individual reach catchments and 2) reach catchments accumulated upstream through the river network. This dataset can be linked to the NHDPlus version 2 data suite by the unique identifier COMID. The source data for 30 year (1971 - 2000) mean annual temperature (Celsius) was produced by the PRISM Group at Oregon State University (PRISM, 2008). Units are degrees celsius. Reach catchment information characterizes data at the local scale. Reach catchments accumulated upstream through the river network characterizes...
Types: Citation;
Tags: 30 year mean annual temperature,
Catchment,
Conterminous United States,
Inlandwaters,
NAWQA,
This tabular data set represents the 30 year (1971 - 2000) mean annual minimum temperature (Celsius) from 800m PRISM data compiled for two spatial components of the NHDPlus version 2 data suite (NHDPlusv2) for the conterminous United States; 1) individual reach catchments and 2) reach catchments accumulated upstream through the river network. This dataset can be linked to the NHDPlus version 2 data suite by the unique identifier COMID. The source data for 30 year (1971 - 2000) mean annual minimum temperature (Celsius) from 800m PRISM data was produced by the PRISM Group at Oregon State University. Units are Degree Celsius. Reach catchment information characterizes data at the local scale. Reach catchments accumulated...
This tabular data set represents annual average temperature values (Celsius) described in Wolock and McCabe (2017), compiled for the NHDPlus version 2 data suite (NHDPlusV2) for the conterminous United States. Linkage of the temperature data with NHDPlusV2 is achieved through the common unique identifier COMID. The temperature values are estimated both for: 1) individual reach catchments and 2) reach catchments accumulated upstream through the river network. The reach catchment information characterizes data at the local scale, whereas the catchments accumulated through the river network characterize cumulative upstream conditions. The network-accumulated values are derived using two methods: 1) divergence routing...
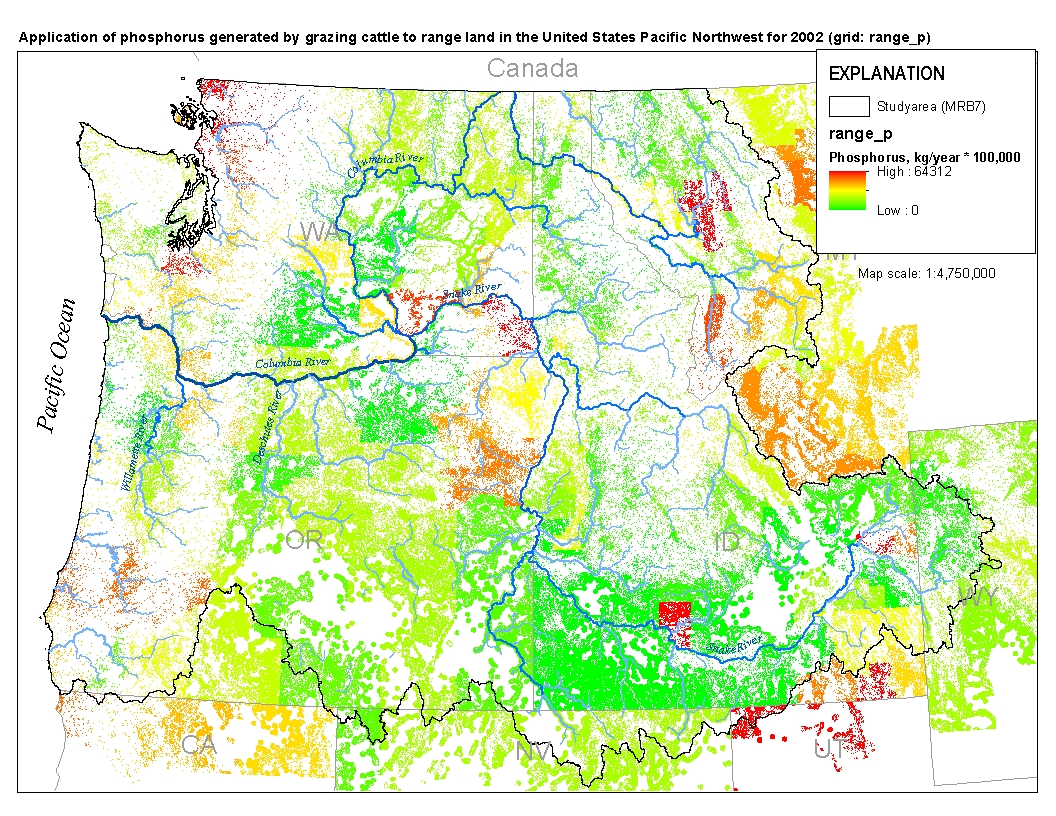
This spatial data set was created by the U.S. Geological Survey (USGS) to represent the amount of phosphorus generated by grazing cattle that was applied to range land in the Pacific Northwest region of the United States (Hydro Region 17; Major River Basin 7 (MRB7)) during 2002.
The NHDPlus Version 1.0 is an integrated suite of application-ready geospatial data sets that incorporate many of the best features of the National Hydrography Dataset (NHD) and the National Elevation Dataset (NED). The NHDPlus includes a stream network (based on the 1:100,000-scale NHD), improved networking, naming, and "value-added attributes" (VAA's). NHDPlus also includes elevation-derived catchments (drainage areas) produced using a drainage enforcement technique first broadly applied in New England, and thus dubbed "The New-England Method". This technique involves "burning-in" the 1:100,000-scale NHD and when available building "walls" using the national Watershed Boundary Dataset (WBD). The resulting modified...
The NHDPlus Version 1.0 is an integrated suite of application-ready geospatial data sets that incorporate many of the best features of the National Hydrography Dataset (NHD) and the National Elevation Dataset (NED). The NHDPlus includes a stream network (based on the 1:100,000-scale NHD), improved networking, naming, and "value-added attributes" (VAA's). NHDPlus also includes elevation-derived catchments (drainage areas) produced using a drainage enforcement technique first broadly applied in New England, and thus dubbed "The New-England Method". This technique involves "burning-in" the 1:100,000-scale NHD and when available building "walls" using the national Watershed Boundary Dataset (WBD). The resulting modified...

These data were released prior to the October 1, 2016 effective date for the USGS’s policy dictating the review, approval, and release of scientific data as referenced in USGS Survey Manual Chapter 502.8 Fundamental Science Practices: Review and Approval of Scientific Data for Release. This spatial data set was created by the U.S. Geological Survey (USGS) to represent mean annual solar radiation in the Pacific Northwest region of the United States (Hydro Region 17; Major River Basin 7 (MRB7)) for the period between 1991 and 2005 within each incremental watershed delineated in the NNHDPlus v2 dataset.

These data were released prior to the October 1, 2016 effective date for the USGS’s policy dictating the review, approval, and release of scientific data as referenced in USGS Survey Manual Chapter 502.8 Fundamental Science Practices: Review and Approval of Scientific Data for Release. This spatial data set was created by the U.S. Geological Survey (USGS) to represent the amount of nitrogen generated by grazing cattle that was applied to range land in the Pacific Northwest region of the United States (Hydro Region 17; Major River Basin 7 (MRB7)) during 2002.

These data were released prior to the October 1, 2016 effective date for the USGS’s policy dictating the review, approval, and release of scientific data as referenced in USGS Survey Manual Chapter 502.8 Fundamental Science Practices: Review and Approval of Scientific Data for Release. This spatial data set was created by the U.S. Geological Survey (USGS) to represent the extent of non-road developed land in the Pacific Northwest region of the United States (Hydro Region 17; Major River Basin 7 (MRB7)) in 2002.

These data were released prior to the October 1, 2016 effective date for the USGS’s policy dictating the review, approval, and release of scientific data as referenced in USGS Survey Manual Chapter 502.8 Fundamental Science Practices: Review and Approval of Scientific Data for Release. This data set represents the average normalized atmospheric (wet) deposition, in kilograms, of Ammonium (NH4) for the year 2002 compiled for every catchment of NHDPlus for the conterminous United States. Estimates of NH4 deposition are based on National Atmospheric Deposition Program (NADP) measurements (B. Larsen, U.S. Geological Survey, written commun., 2007). De-trending methods applied to the year 2002 are described in Alexander...

These data were released prior to the October 1, 2016 effective date for the USGS’s policy dictating the review, approval, and release of scientific data as referenced in USGS Survey Manual Chapter 502.8 Fundamental Science Practices: Review and Approval of Scientific Data for Release. This tabular data set represents the mean value for infiltration-excess overland flow as estimated by the watershed model TOPMODEL, compiled for every catchment of NHDPlus for the conterminous United States. Infiltration-excess overland flow, expressed as a percent of total overland flow, is simulated in TOPMODEL as precipitation that exceeds the infiltration capacity of the soil and enters the stream channel. The source data set...

These data were released prior to the October 1, 2016 effective date for the USGS’s policy dictating the review, approval, and release of scientific data as referenced in USGS Survey Manual Chapter 502.8 Fundamental Science Practices: Review and Approval of Scientific Data for Release. This data set represents the estimated amount of nitrogen and phosphorus in kilograms for the year 2002, compiled for every catchment of NHDPlus for the conterminous United States. The source data set is County-Level Estimates of Nutrient Inputs to the Land Surface of the Conterminous United States, 1982-2001 (Ruddy and others, 2006). The NHDPlus Version 1.1 is an integrated suite of application-ready geospatial datasets that incorporates...

These data were released prior to the October 1, 2016 effective date for the USGS’s policy dictating the review, approval, and release of scientific data as referenced in USGS Survey Manual Chapter 502.8 Fundamental Science Practices: Review and Approval of Scientific Data for Release. This tabular data set represents the mean percent tree canopy from the Canopy Layer of the National Land Cover Dataset 2001 (LaMotte and Wieczorek, 2010), compiled for every MRB_E2RF1 catchment of Major River Basins (MRBs, Crawford and others, 2006). The source data set represents tree canopy percentage for the conterminous United States for 2001. The Canopy Layer of the National Land Cover Data Set for 2001 was produced through...

These data were released prior to the October 1, 2016 effective date for the USGS’s policy dictating the review, approval, and release of scientific data as referenced in USGS Survey Manual Chapter 502.8 Fundamental Science Practices: Review and Approval of Scientific Data for Release. This tabular data set represents the estimated area of land use and land cover from the National Land Cover Dataset 2001 (LaMotte, 2008), compiled for every MRB_E2RF1 catchment of the Major River Basins (MRBs, Crawford and others, 2006). The source data set represents land use and land cover for the conterminous United States for 2001. The National Land Cover Data Set for 2001 was produced through a cooperative project conducted...
|

|
