Filters: Tags: SUNLIGHT (X)
17 results (26ms)|
Filters
Date Range
Types Contacts
Categories Tag Types
|
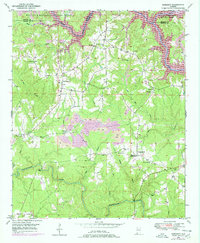
USGS Historical Quadrangle in GeoPDF.
ADMMR map collection: Towne Plat Showing Claims; 1 in. to 400 feet; 9 x 11 in.
ADMMR map collection: Towne Underground Sketch Map; 22 x 15 in.
This data set contains imagery from the National Agriculture Imagery Program (NAIP). The NAIP program is administered by USDA FSA and has been established to support two main FSA strategic goals centered on agricultural production. These are, increase stewardship of America's natural resources while enhancing the environment, and to ensure commodities are procured and distributed effectively and efficiently to increase food security. The NAIP program supports these goals by acquiring and providing ortho imagery that has been collected during the agricultural growing season in the U.S. The NAIP ortho imagery is tailored to meet FSA requirements and is a fundamental tool used to support FSA farm and conservation programs....
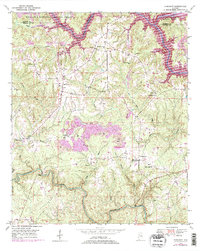
USGS Historical Quadrangle in GeoPDF.
ADMMR map collection: Towne Underground Assay Map; 1 in. to 20 feet; 24 x 20 in.
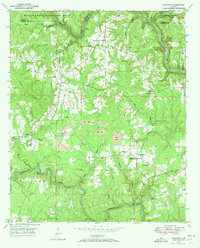
USGS Historical Quadrangle in GeoPDF.
ADMMR map collection: Towne Claim Map; 1 in. to 600 feet; 11 x 9 in.
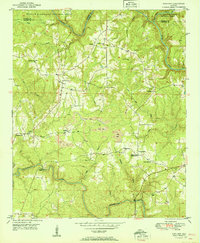
USGS Historical Quadrangle in GeoPDF.
ADMMR map collection: Towne Underground Assay Map; 22 x 16 in.
This location is part of the Arizona Mineral Industry Location System (AzMILS), an inventory of mineral occurences, prospects and mine locations in Arizona. Mohave121E is located in T23N R18W Sec 10 SE in the Chloride - 7.5 Min quad. This collection consists of various reports, maps, records and related materials acquired by the Arizona Department of Mines and Mineral Resources regarding mining properties in Arizona. Information was obtained by various means, including the property owners, exploration companies, consultants, verbal interviews, field visits, newspapers and publications. Some sections may be redacted for copyright. Please see the access statement.
This data set contains imagery from the National Agriculture Imagery Program (NAIP). The NAIP program is administered by USDA FSA and has been established to support two main FSA strategic goals centered on agricultural production. These are, increase stewardship of America's natural resources while enhancing the environment, and to ensure commodities are procured and distributed effectively and efficiently to increase food security. The NAIP program supports these goals by acquiring and providing ortho imagery that has been collected during the agricultural growing season in the U.S. The NAIP ortho imagery is tailored to meet FSA requirements and is a fundamental tool used to support FSA farm and conservation programs....
This data set contains imagery from the National Agriculture Imagery Program (NAIP). The NAIP program is administered by USDA FSA and has been established to support two main FSA strategic goals centered on agricultural production. These are, increase stewardship of America's natural resources while enhancing the environment, and to ensure commodities are procured and distributed effectively and efficiently to increase food security. The NAIP program supports these goals by acquiring and providing ortho imagery that has been collected during the agricultural growing season in the U.S. The NAIP ortho imagery is tailored to meet FSA requirements and is a fundamental tool used to support FSA farm and conservation programs....
This data set contains imagery from the National Agriculture Imagery Program (NAIP). The NAIP program is administered by USDA FSA and has been established to support two main FSA strategic goals centered on agricultural production. These are, increase stewardship of America's natural resources while enhancing the environment, and to ensure commodities are procured and distributed effectively and efficiently to increase food security. The NAIP program supports these goals by acquiring and providing ortho imagery that has been collected during the agricultural growing season in the U.S. The NAIP ortho imagery is tailored to meet FSA requirements and is a fundamental tool used to support FSA farm and conservation programs....
USGS Historical Quadrangle in GeoPDF.
USGS Historical Quadrangle in GeoPDF.
These data were compiled to investigate differentiation in physiological activity varies through time for different functional groups. These include the seasonal progress of 13 plant species representing perennial C3 shrub, C3 grass, C4 grass, and annual forb functional groups of the Colorado Plateau, USA. These data can be used to test for differences in carbon assimilation strategies (SeasonalEcophyAciData) and how photosynthetic rates related to climate (SeasonalEcophyMonthlyData). Data can be arranged at the seasonal, annual, species-, or functional group-levels to compare multi-level processes.
|

|
