Filters: Tags: San Bernardino County (X)
1,682 results (27ms)|
Filters
Date Range
Extensions (Less) Types (Less)
Contacts (Less)
Categories (Less) Tag Types
|
This dataset consists of 65 magnetotelluric (MT) stations collected in 2015 near Mountain Pass, California. The U.S. Geological Survey acquired these data to create a regional conductivity model near the Mountain Pass mine. This work is in support of characterizing mineral deposits.
The 'Thum Bum San Bernardino County' file is part of the Grover Heinrichs mining collection. Grover was the Vice President of Heinrichs GEOEXploration, located in Tucson, Arizona. The collection contains over 1,400 folders including economic geology reports, maps, photos, correspondence, drill logs and other related materials. The focus of much of the information is on the western United States, particularly Arizona, but the collection also includes files on mining activity throughout the United States, foreign countries, and 82 mineral commodities.
Categories: Data;
Tags: California,
Dataset,
San Bernardino County,
United States,
geoscientificInformation,
The 'Calico Mining District' file is part of the Grover Heinrichs mining collection. Grover was the Vice President of Heinrichs GEOEXploration, located in Tucson, Arizona. The collection contains over 1,400 folders including economic geology reports, maps, photos, correspondence, drill logs and other related materials. The focus of much of the information is on the western United States, particularly Arizona, but the collection also includes files on mining activity throughout the United States, foreign countries, and 82 mineral commodities.
Categories: Data;
Tags: California,
Dataset,
San Bernardino County,
United States,
geoscientificInformation,
The 'Randsburg Quadrangle, Yellow Aster Mine' file is part of the Grover Heinrichs mining collection. Grover was the Vice President of Heinrichs GEOEXploration, located in Tucson, Arizona. The collection contains over 1,400 folders including economic geology reports, maps, photos, correspondence, drill logs and other related materials. The focus of much of the information is on the western United States, particularly Arizona, but the collection also includes files on mining activity throughout the United States, foreign countries, and 82 mineral commodities.
Categories: Data;
Tags: California,
Dataset,
San Bernardino County,
United States,
geoscientificInformation,
This dataset consists of 65 magnetotelluric (MT) stations collected in 2015 near Mountain Pass, California. The U.S. Geological Survey acquired these data to create a regional conductivity model near the Mountain Pass mine. This work is in support of characterizing mineral deposits.
The 'Randsburg Quadrangle, San Bernardino and Kern Counties' file is part of the Grover Heinrichs mining collection. Grover was the Vice President of Heinrichs GEOEXploration, located in Tucson, Arizona. The collection contains over 1,400 folders including economic geology reports, maps, photos, correspondence, drill logs and other related materials. The focus of much of the information is on the western United States, particularly Arizona, but the collection also includes files on mining activity throughout the United States, foreign countries, and 82 mineral commodities.
Categories: Data;
Tags: California,
Dataset,
San Bernardino County,
United States,
geoscientificInformation,
The 'General - San Bernardino County #1' file is part of the Grover Heinrichs mining collection. Grover was the Vice President of Heinrichs GEOEXploration, located in Tucson, Arizona. The collection contains over 1,400 folders including economic geology reports, maps, photos, correspondence, drill logs and other related materials. The focus of much of the information is on the western United States, particularly Arizona, but the collection also includes files on mining activity throughout the United States, foreign countries, and 82 mineral commodities.
Categories: Data;
Tags: California,
Dataset,
San Bernardino County,
United States,
geoscientificInformation,
This dataset consists of 65 magnetotelluric (MT) stations collected in 2015 near Mountain Pass, California. The U.S. Geological Survey acquired these data to create a regional conductivity model near the Mountain Pass mine. This work is in support of characterizing mineral deposits.
This dataset consists of 65 magnetotelluric (MT) stations collected in 2015 near Mountain Pass, California. The U.S. Geological Survey acquired these data to create a regional conductivity model near the Mountain Pass mine. This work is in support of characterizing mineral deposits.
This dataset consists of 65 magnetotelluric (MT) stations collected in 2015 near Mountain Pass, California. The U.S. Geological Survey acquired these data to create a regional conductivity model near the Mountain Pass mine. This work is in support of characterizing mineral deposits.
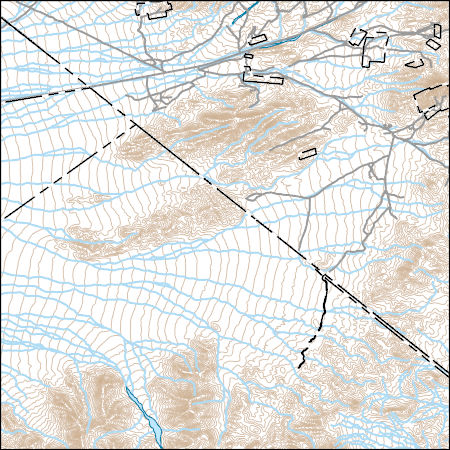
Layers of geospatial data include contours, boundaries, land cover, hydrography, roads, transportation, geographic names, structures, and other selected map features.
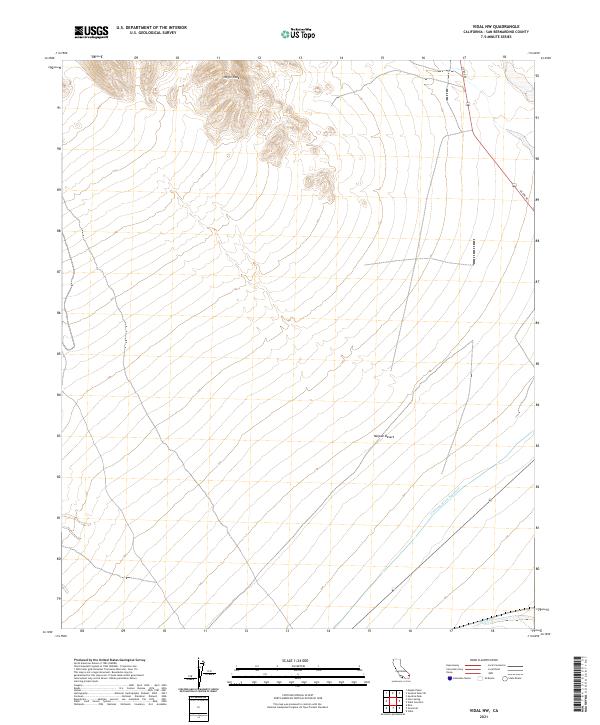
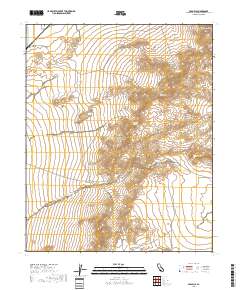
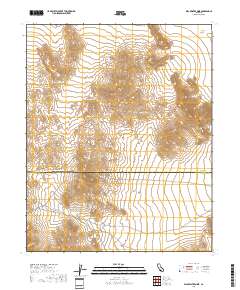
Layered geospatial PDF 7.5 Minute Quadrangle Map. Layers of geospatial data include orthoimagery, roads, grids, geographic names, elevation contours, hydrography, and other selected map features. This map is derived from GIS (geospatial information system) data. It represents a repackaging of GIS data in traditional map form, not creation of new information. The geospatial data in this map are from selected National Map data holdings and other government sources.
Layered geospatial PDF 7.5 Minute Quadrangle Map. Layers of geospatial data include orthoimagery, roads, grids, geographic names, elevation contours, hydrography, and other selected map features. This map is derived from GIS (geospatial information system) data. It represents a repackaging of GIS data in traditional map form, not creation of new information. The geospatial data in this map are from selected National Map data holdings and other government sources.
Layered geospatial PDF 7.5 Minute Quadrangle Map. Layers of geospatial data include orthoimagery, roads, grids, geographic names, elevation contours, hydrography, and other selected map features. This map is derived from GIS (geospatial information system) data. It represents a repackaging of GIS data in traditional map form, not creation of new information. The geospatial data in this map are from selected National Map data holdings and other government sources.
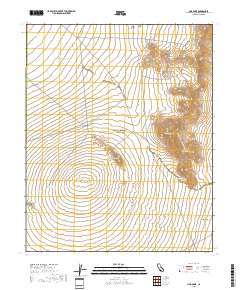
Layered geospatial PDF 7.5 Minute Quadrangle Map. Layers of geospatial data include orthoimagery, roads, grids, geographic names, elevation contours, hydrography, and other selected map features. This map is derived from GIS (geospatial information system) data. It represents a repackaging of GIS data in traditional map form, not creation of new information. The geospatial data in this map are from selected National Map data holdings and other government sources.
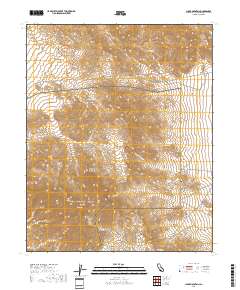
Layered geospatial PDF 7.5 Minute Quadrangle Map. Layers of geospatial data include orthoimagery, roads, grids, geographic names, elevation contours, hydrography, and other selected map features. This map is derived from GIS (geospatial information system) data. It represents a repackaging of GIS data in traditional map form, not creation of new information. The geospatial data in this map are from selected National Map data holdings and other government sources.
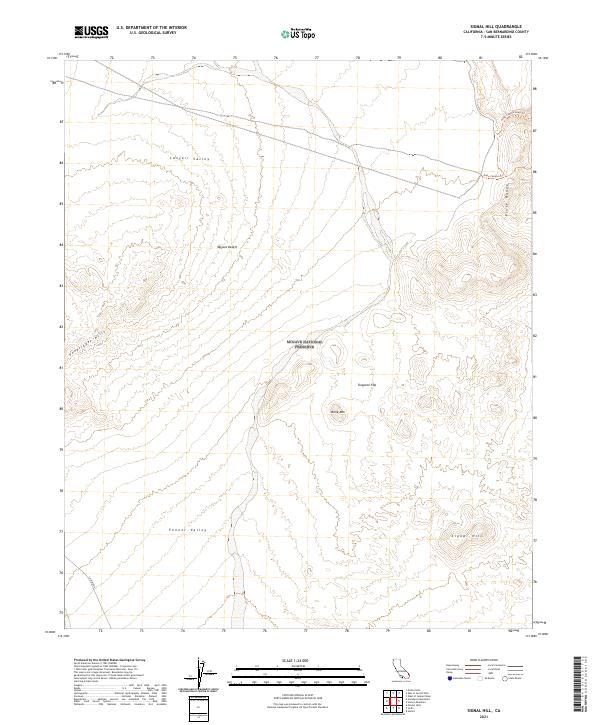
Layered geospatial PDF 7.5 Minute Quadrangle Map. Layers of geospatial data include orthoimagery, roads, grids, geographic names, elevation contours, hydrography, and other selected map features. This map is derived from GIS (geospatial information system) data. It represents a repackaging of GIS data in traditional map form, not creation of new information. The geospatial data in this map are from selected National Map data holdings and other government sources.
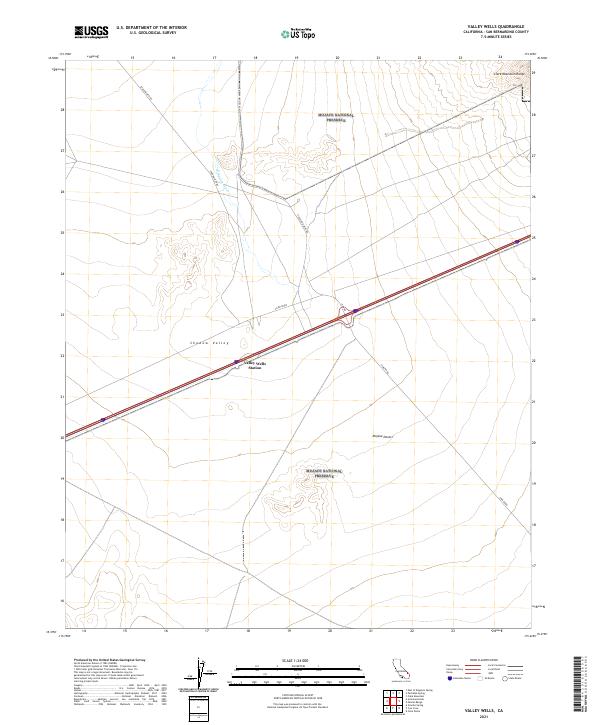
Layered geospatial PDF 7.5 Minute Quadrangle Map. Layers of geospatial data include orthoimagery, roads, grids, geographic names, elevation contours, hydrography, and other selected map features. This map is derived from GIS (geospatial information system) data. It represents a repackaging of GIS data in traditional map form, not creation of new information. The geospatial data in this map are from selected National Map data holdings and other government sources.
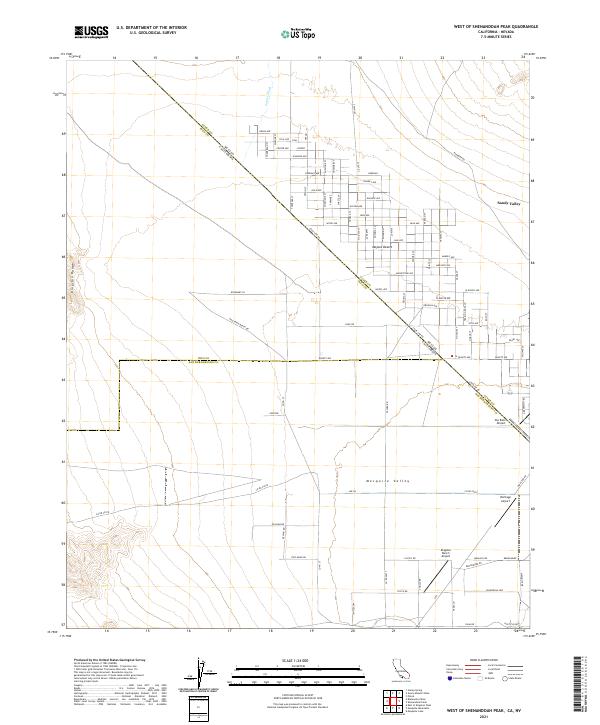
Layered geospatial PDF 7.5 Minute Quadrangle Map. Layers of geospatial data include orthoimagery, roads, grids, geographic names, elevation contours, hydrography, and other selected map features. This map is derived from GIS (geospatial information system) data. It represents a repackaging of GIS data in traditional map form, not creation of new information. The geospatial data in this map are from selected National Map data holdings and other government sources.
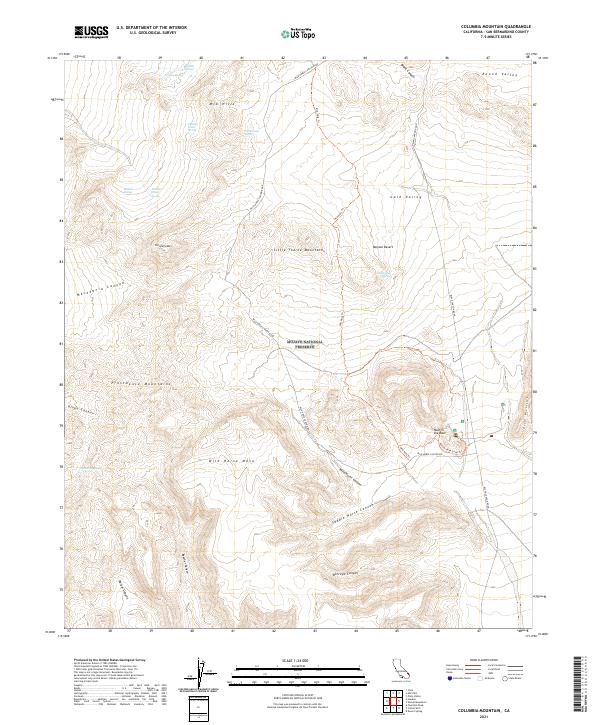
Layered geospatial PDF 7.5 Minute Quadrangle Map. Layers of geospatial data include orthoimagery, roads, grids, geographic names, elevation contours, hydrography, and other selected map features. This map is derived from GIS (geospatial information system) data. It represents a repackaging of GIS data in traditional map form, not creation of new information. The geospatial data in this map are from selected National Map data holdings and other government sources.
|

|
