Filters: Tags: San Bernardino County (X)
1,682 results (196ms)|
Filters
Date Range
Extensions Types Contacts
Categories Tag Types
|
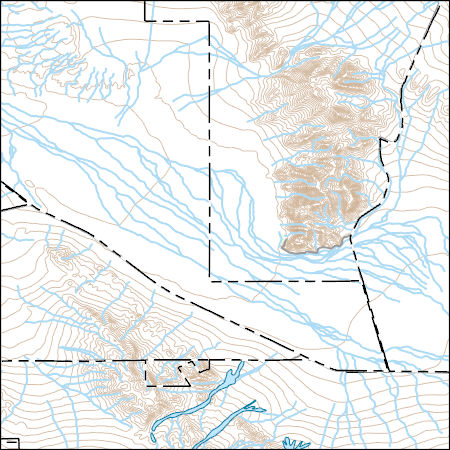
Layered geospatial PDF 7.5 Minute Quadrangle Map. Layers of geospatial data include orthoimagery, roads, grids, geographic names, elevation contours, hydrography, and other selected map features. This map is derived from GIS (geospatial information system) data. It represents a repackaging of GIS data in traditional map form, not creation of new information. The geospatial data in this map are from selected National Map data holdings and other government sources.
Layered geospatial PDF 7.5 Minute Quadrangle Map. Layers of geospatial data include orthoimagery, roads, grids, geographic names, elevation contours, hydrography, and other selected map features. This map is derived from GIS (geospatial information system) data. It represents a repackaging of GIS data in traditional map form, not creation of new information. The geospatial data in this map are from selected National Map data holdings and other government sources.
Layered geospatial PDF 7.5 Minute Quadrangle Map. Layers of geospatial data include orthoimagery, roads, grids, geographic names, elevation contours, hydrography, and other selected map features. This map is derived from GIS (geospatial information system) data. It represents a repackaging of GIS data in traditional map form, not creation of new information. The geospatial data in this map are from selected National Map data holdings and other government sources.
Layered geospatial PDF 7.5 Minute Quadrangle Map. Layers of geospatial data include orthoimagery, roads, grids, geographic names, elevation contours, hydrography, and other selected map features. This map is derived from GIS (geospatial information system) data. It represents a repackaging of GIS data in traditional map form, not creation of new information. The geospatial data in this map are from selected National Map data holdings and other government sources.
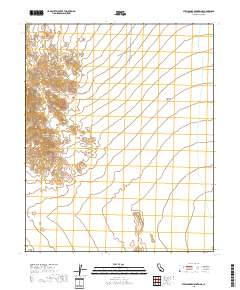
Layered geospatial PDF 7.5 Minute Quadrangle Map. Layers of geospatial data include orthoimagery, roads, grids, geographic names, elevation contours, hydrography, and other selected map features. This map is derived from GIS (geospatial information system) data. It represents a repackaging of GIS data in traditional map form, not creation of new information. The geospatial data in this map are from selected National Map data holdings and other government sources.
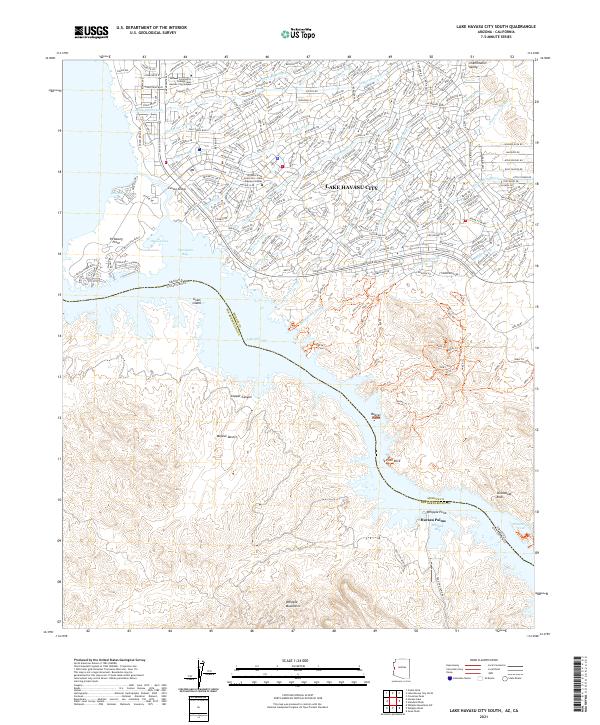
Layered geospatial PDF 7.5 Minute Quadrangle Map. Layers of geospatial data include orthoimagery, roads, grids, geographic names, elevation contours, hydrography, and other selected map features. This map is derived from GIS (geospatial information system) data. It represents a repackaging of GIS data in traditional map form, not creation of new information. The geospatial data in this map are from selected National Map data holdings and other government sources.
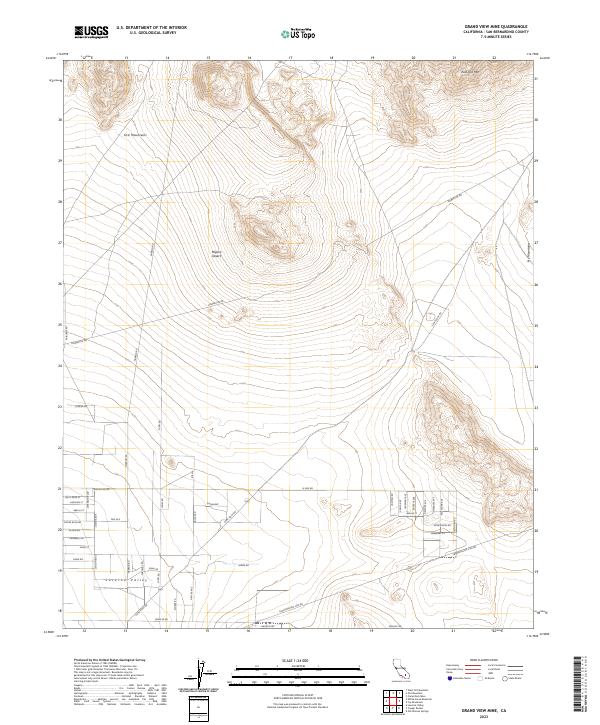
Layered geospatial PDF 7.5 Minute Quadrangle Map. Layers of geospatial data include orthoimagery, roads, grids, geographic names, elevation contours, hydrography, and other selected map features. This map is derived from GIS (geospatial information system) data. It represents a repackaging of GIS data in traditional map form, not creation of new information. The geospatial data in this map are from selected National Map data holdings and other government sources.

These data were released prior to the October 1, 2016 effective date for the USGS’s policy dictating the review, approval, and release of scientific data as referenced in USGS Survey Manual Chapter 502.8 Fundamental Science Practices: Review and Approval of Scientific Data for Release. This digital data set defines the boundary of the area contributing ground-water flow to the Death Valley regional ground-water flow-system (DVRFS) model domain. The boundary encompasses an approximate 112,000 square-kilometer region and was based on a map of regional potential developed by Bedinger and Harrill (2004). Where possible, the amount of lateral flow across the segments of the DVRFS model boundary from (or to) the contributing...

A three-dimensional, groundwater-flow model developed by Halford and Jackson (https://doi.org/10.3133/pp1863) was used to simulate effects of future (2020—2120) groundwater pumping on water levels and natural discharges in the Alkali Flat–Furnace Creek Ranch (AFFCR), Ash Meadows, Pahute Mesa–Oasis Valley (PMOV), and Pahrump to Death Valley South (PDVS) groundwater basins, southern Nevada and California. Four pumping scenarios were simulated, including a base case and scenarios A, B, and C. Scenarios were simulated from 1913 to 2120, with historical pumping occurring from 1913 to 2010, historical 2010 pumping rates projected from 2010 to 2020, and scenario pumping beginning in 2020. The base case projected 2010 pumping...
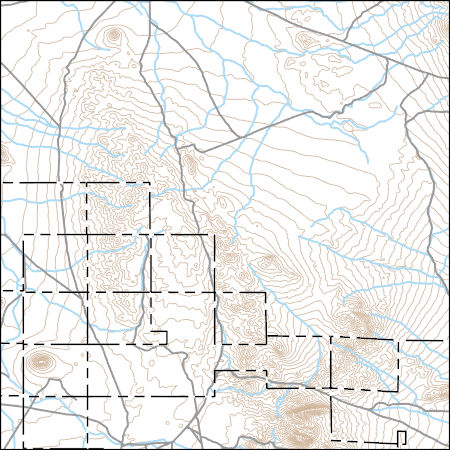
Layers of geospatial data include contours, boundaries, land cover, hydrography, roads, transportation, geographic names, structures, and other selected map features.
Layers of geospatial data include contours, boundaries, land cover, hydrography, roads, transportation, geographic names, structures, and other selected map features.
Layers of geospatial data include contours, boundaries, land cover, hydrography, roads, transportation, geographic names, structures, and other selected map features.
Layers of geospatial data include contours, boundaries, land cover, hydrography, roads, transportation, geographic names, structures, and other selected map features.
This data release is currently being revised and is temporarily unavailable. Please contact rhkent@usgs.gov with any immediate requests. The U.S. Geological Survey Groundwater Ambient Monitoring and Assessment-Priority Basin Project (USGS GAMA-PBP) collected samples to be analyzed for per-and polyfluoroalkyl substances (PFAS) from domestic and public supply wells from May 2019 to September 2020. The datasets presented here include identification of the 28 PFAS constituents monitored by the project, Identification and brief characterization of the 211 GAMA-PBP wells for which samples were analyzed for PFAS during the study period, and analytical results for those groundwater samples, along with results for quality...
Categories: Data;
Tags: California,
Colusa County,
Environmental Health,
Geochemistry,
Humboldt County,
Layers of geospatial data include contours, boundaries, land cover, hydrography, roads, transportation, geographic names, structures, and other selected map features.
Layers of geospatial data include contours, boundaries, land cover, hydrography, roads, transportation, geographic names, structures, and other selected map features.
Layers of geospatial data include contours, boundaries, land cover, hydrography, roads, transportation, geographic names, structures, and other selected map features.
Layers of geospatial data include contours, boundaries, land cover, hydrography, roads, transportation, geographic names, structures, and other selected map features.
Layers of geospatial data include contours, boundaries, land cover, hydrography, roads, transportation, geographic names, structures, and other selected map features.
Layers of geospatial data include contours, boundaries, land cover, hydrography, roads, transportation, geographic names, structures, and other selected map features.
|

|
