Filters: Tags: San Francisco (X)
117 results (44ms)|
Filters
Date Range
Extensions Types Contacts
Categories Tag Types
|
USGS HayWired earthquake scenario landslide probability Map service created to support the The HayWired Scenario: An Urban Earthquake in a Connected World story map. More information on the HayWired scenario: Detweiler, S.T., and Wein, A.M., eds., 2017, The HayWired earthquake scenario—Earthquake hazards: U.S. Geological Survey Scientific Investigations Report 2017–5013–A–H, 126 p., https://doi.org/10.3133/sir20175013v1
Categories: Data;
Types: ArcGIS REST Map Service,
ArcGIS Service Definition,
Downloadable,
Map Service;
Tags: California,
HayWired,
San Francisco,
USGS,
earthquake,
This data set contains imagery from the National Agriculture Imagery Program (NAIP). The NAIP program is administered by USDA FSA and has been established to support two main FSA strategic goals centered on agricultural production. These are, increase stewardship of America's natural resources while enhancing the environment, and to ensure commodities are procured and distributed effectively and efficiently to increase food security. The NAIP program supports these goals by acquiring and providing ortho imagery that has been collected during the agricultural growing season in the U.S. The NAIP ortho imagery is tailored to meet FSA requirements and is a fundamental tool used to support FSA farm and conservation programs....
This data set contains imagery from the National Agriculture Imagery Program (NAIP). The NAIP program is administered by USDA FSA and has been established to support two main FSA strategic goals centered on agricultural production. These are, increase stewardship of America's natural resources while enhancing the environment, and to ensure commodities are procured and distributed effectively and efficiently to increase food security. The NAIP program supports these goals by acquiring and providing ortho imagery that has been collected during the agricultural growing season in the U.S. The NAIP ortho imagery is tailored to meet FSA requirements and is a fundamental tool used to support FSA farm and conservation programs....
This data set contains imagery from the National Agriculture Imagery Program (NAIP). The NAIP program is administered by USDA FSA and has been established to support two main FSA strategic goals centered on agricultural production. These are, increase stewardship of America's natural resources while enhancing the environment, and to ensure commodities are procured and distributed effectively and efficiently to increase food security. The NAIP program supports these goals by acquiring and providing ortho imagery that has been collected during the agricultural growing season in the U.S. The NAIP ortho imagery is tailored to meet FSA requirements and is a fundamental tool used to support FSA farm and conservation programs....
ADCP Data in Support of Water and Suspended-Sediment Flux Measurements at the Golden Gate, 2016-2017
Field observations of water and suspended-sediment fluxes at the Golden Gate were made over one ebb tide and one flood tide on three occasions: 1) 21-22 March 2016, following a large storm event that triggered the first flow into Yolo Bypass flood control structure since 2011; 2) 23 June of 2016, during a period of low freshwater inflow and 3) 27-28 February 2017, following several large storms of the wettest winter in northern California in recorded history. On each occasion, flux of water and suspended sediment were estimated using data from a boat-mounted acoustic Doppler current profiler. This instrument provided high-resolution velocity and acoustic backscatter (ABS) data at a cross-section (“transect”) near...
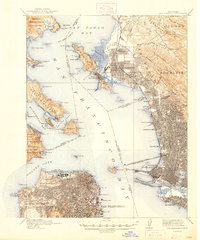
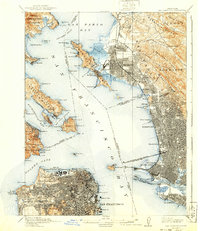
USGS Historical Quadrangle in GeoPDF.
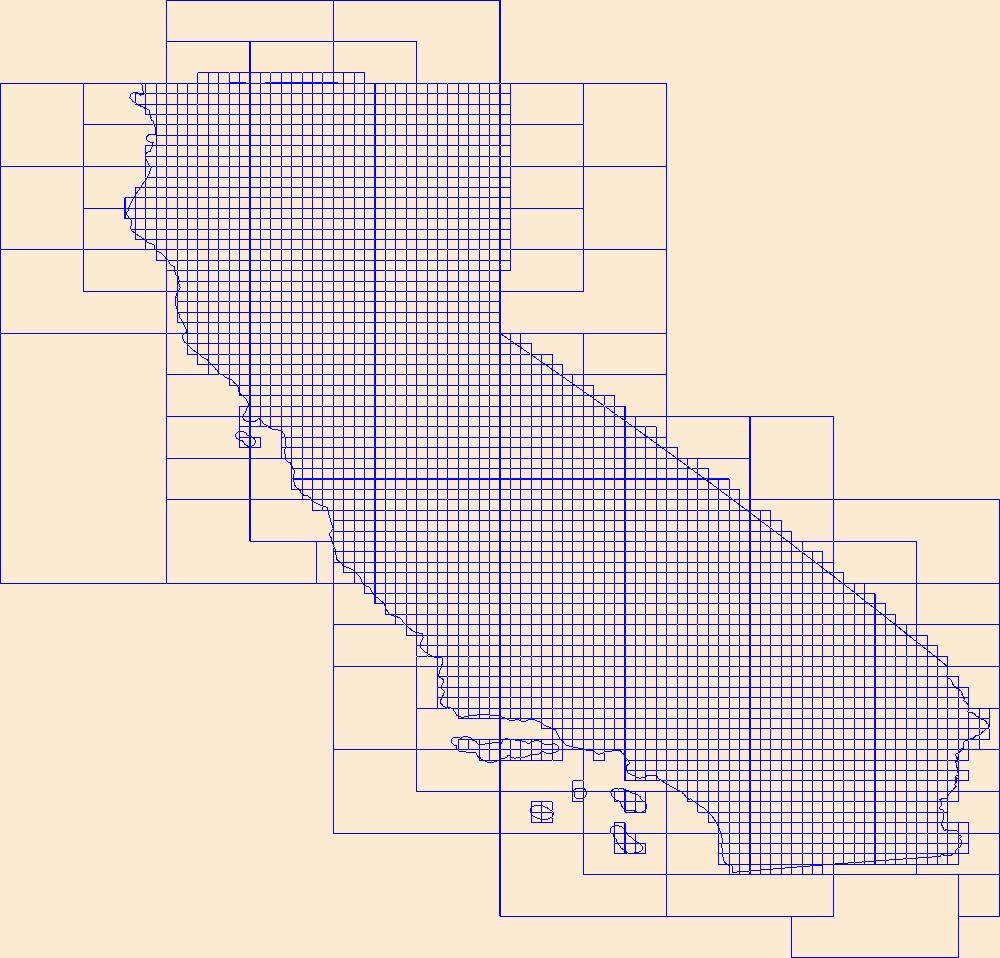
This data represents the map extent for current and historical USGS topographic maps for the United States and Territories, including 1 X 2 Degree, 1 X 1 Degree, 30 X 60 Minute, 15 X 15 Minute, 7.5 X 7.5 Minute, and 3.75 X 3.75 Minute. The grid was generated using ESRI ArcInfo GIS software.
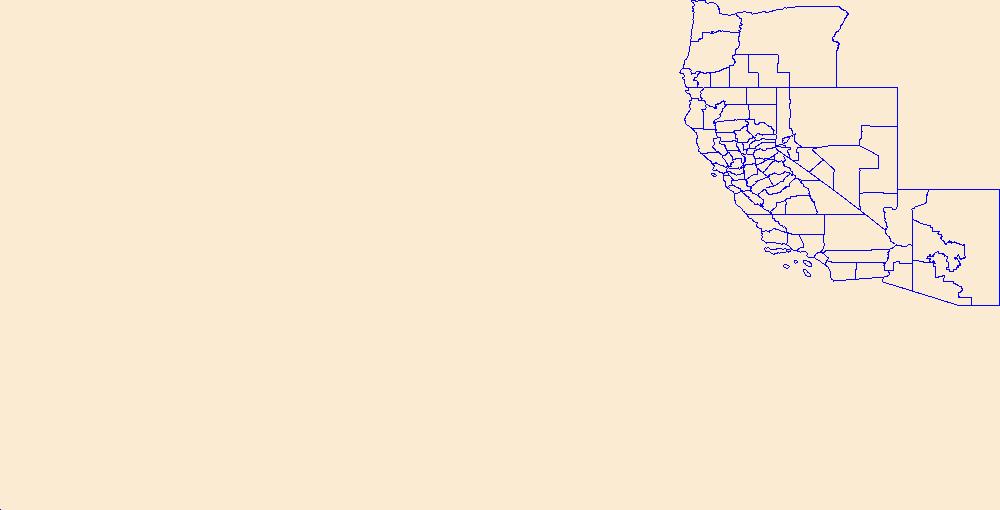
Geospatial data is comprised of government boundaries.
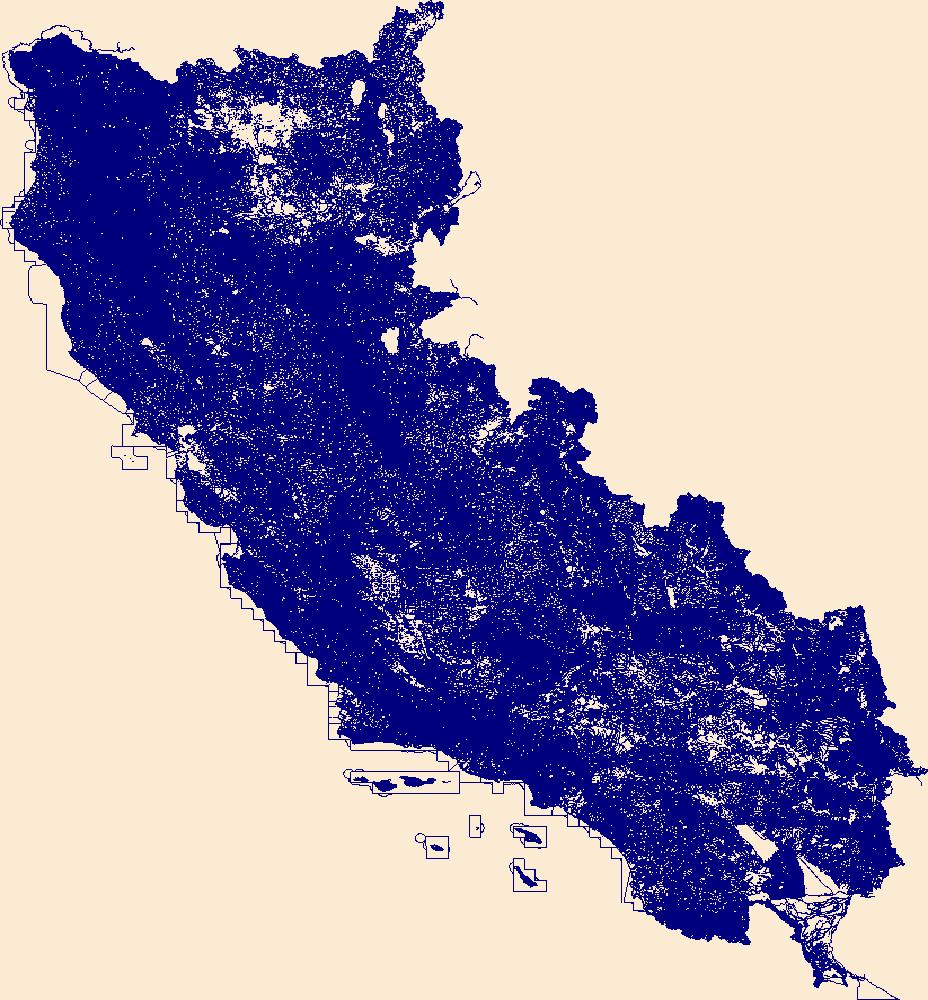
The National Hydrography Dataset (NHD) is a feature-based database that interconnects and uniquely identifies the stream segments or reaches that make up the nation's surface water drainage system. NHD data was originally developed at 1:100,000-scale and exists at that scale for the whole country. This high-resolution NHD, generally developed at 1:24,000/1:12,000 scale, adds detail to the original 1:100,000-scale NHD. (Data for Alaska, Puerto Rico and the Virgin Islands was developed at high-resolution, not 1:100,000 scale.) Local resolution NHD is being developed where partners and data exist. The NHD contains reach codes for networked features, flow direction, names, and centerline representations for areal water...
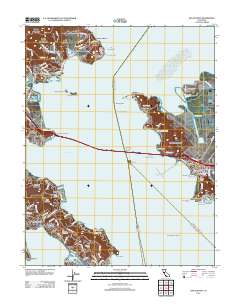
Layered GeoPDF 7.5 Minute Quadrangle Map. Layers of geospatial data include orthoimagery, roads, grids, geographic names, elevation contours, hydrography, and other selected map features.
Layered GeoPDF 7.5 Minute Quadrangle Map. Layers of geospatial data include orthoimagery, roads, grids, geographic names, elevation contours, hydrography, and other selected map features.
USGS Historical Quadrangle in GeoPDF.
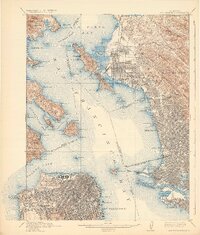
USGS Historical Quadrangle in GeoPDF.
USGS Historical Quadrangle in GeoPDF.
High-resolution single-channel Chirp and minisparker seismic-reflection data were collected by the U.S. Geological Survey in March and April 2007, offshore San Mateo County, California. Data were collected aboard the R/V Fulmar during field activity F-02-07-NC. Chirp data were collected using an EdgeTech 512 chirp subbottom system and were recorded with a Triton SB-Logger. Minisparker data were collected using a SIG 2-mille minisparker sound source combined with a single-channel streamer, and both were recorded with a Triton SB-Logger.
Categories: Data;
Types: Downloadable,
Map Service,
OGC WFS Layer,
OGC WMS Layer,
Shapefile;
Tags: Bathymetry and Elevation,
CMHRP,
Coastal and Marine Hazards and Resources Program,
Elevation,
Geophysics,
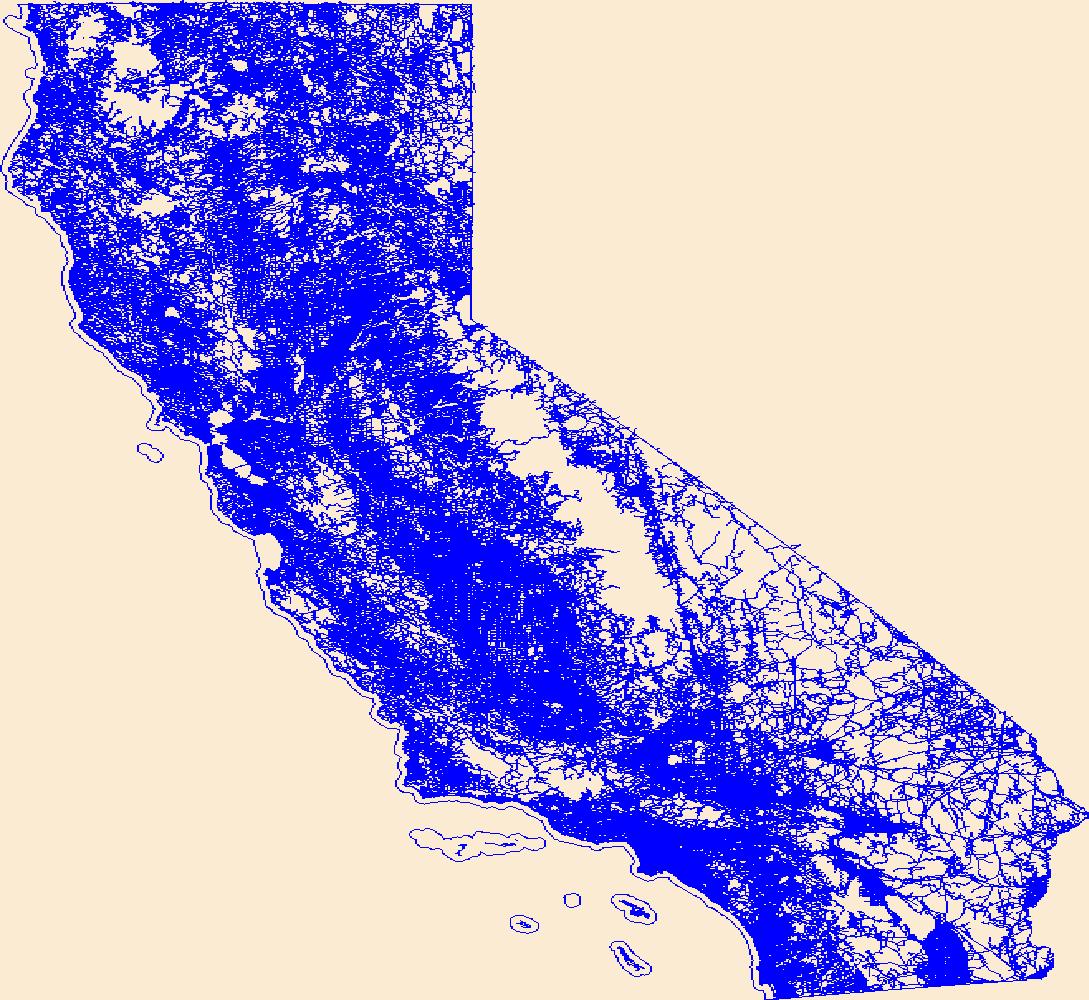
Layers of geospatial data include roads, airports, trails, and railroads.
This data set contains imagery from the National Agriculture Imagery Program (NAIP). The NAIP program is administered by USDA FSA and has been established to support two main FSA strategic goals centered on agricultural production. These are, increase stewardship of America's natural resources while enhancing the environment, and to ensure commodities are procured and distributed effectively and efficiently to increase food security. The NAIP program supports these goals by acquiring and providing ortho imagery that has been collected during the agricultural growing season in the U.S. The NAIP ortho imagery is tailored to meet FSA requirements and is a fundamental tool used to support FSA farm and conservation programs....
ADMMR map collection: Map showing claims in the King Solomon Gulch; 1 in. to 200 feet; 36 x 51 in.
This data set contains imagery from the National Agriculture Imagery Program (NAIP). The NAIP program is administered by USDA FSA and has been established to support two main FSA strategic goals centered on agricultural production. These are, increase stewardship of America's natural resources while enhancing the environment, and to ensure commodities are procured and distributed effectively and efficiently to increase food security. The NAIP program supports these goals by acquiring and providing ortho imagery that has been collected during the agricultural growing season in the U.S. The NAIP ortho imagery is tailored to meet FSA requirements and is a fundamental tool used to support FSA farm and conservation programs....
Layered GeoPDF 7.5 Minute Quadrangle Map. Layers of geospatial data include orthoimagery, roads, grids, geographic names, elevation contours, hydrography, and other selected map features.
|

|
