Filters: Tags: San Francisco County (X)
71 results (110ms)|
Filters
Date Range
Types Contacts
Categories Tag Types Tag Schemes |
This data contains maximum depth of flooding (cm) in the region landward of the present-day shoreline for the sea-level rise (SLR) and storm condition indicated. The Coastal Storm Modeling System (CoSMoS) makes detailed predictions (meter-scale) over large geographic scales (100s of kilometers) of storm-induced coastal flooding and erosion for both current and future sea-level rise (SLR) scenarios. Projections for CoSMoS v3.1 in Central California include flood-hazard information for the coast from Pt. Conception to the Golden Gate bridge. Outputs include SLR scenarios of 0.0, 0.25, 0.5, 0.75, 1.0, 1.5, 2.0, 2.5, 3.0, and 5.0 meters; storm scenarios include background conditions (astronomic spring tide and average...
Categories: Data;
Types: Map Service,
OGC WFS Layer,
OGC WMS Layer,
OGC WMS Service;
Tags: Beaches,
CMHRP,
Central California,
Central California Coast,
Climate change,
This data contains maximum model-derived significant wave height (in meters) for the sea-level rise (SLR) and storm condition indicated. The Coastal Storm Modeling System (CoSMoS) makes detailed predictions (meter-scale) over large geographic scales (100s of kilometers) of storm-induced coastal flooding and erosion for both current and future sea-level rise (SLR) scenarios. Projections for CoSMoS v3.1 in Central California include flood-hazard information for the coast from Pt. Conception to the Golden Gate bridge. Outputs include SLR scenarios of 0.0, 0.25, 0.5, 0.75, 1.0, 1.5, 2.0, 2.5, 3.0, and 5.0 meters; storm scenarios include background conditions (astronomic spring tide and average atmospheric conditions)...
Categories: Data;
Types: Map Service,
OGC WFS Layer,
OGC WMS Layer,
OGC WMS Service;
Tags: Beaches,
CMHRP,
Central California,
Central California Coast,
Climate change,
This data contains maximum depth of flooding (cm) in the region landward of the present-day shoreline for the sea-level rise (SLR) and storm condition indicated. The Coastal Storm Modeling System (CoSMoS) makes detailed predictions (meter-scale) over large geographic scales (100s of kilometers) of storm-induced coastal flooding and erosion for both current and future sea-level rise (SLR) scenarios. Projections for CoSMoS v3.1 in Central California include flood-hazard information for the coast from Pt. Conception to the Golden Gate bridge. Outputs include SLR scenarios of 0.0, 0.25, 0.5, 0.75, 1.0, 1.5, 2.0, 2.5, 3.0, and 5.0 meters; storm scenarios include background conditions (astronomic spring tide and average...
Categories: Data;
Types: Map Service,
OGC WFS Layer,
OGC WMS Layer,
OGC WMS Service;
Tags: Beaches,
CMHRP,
Central California,
Central California Coast,
Climate change,
This data contains maximum model-derived ocean currents (in meters per second) for the sea-level rise (SLR) and storm condition indicated. The Coastal Storm Modeling System (CoSMoS) makes detailed predictions (meter-scale) over large geographic scales (100s of kilometers) of storm-induced coastal flooding and erosion for both current and future sea-level rise (SLR) scenarios. Projections for CoSMoS v3.1 in Central California include flood-hazard information for the coast from Pt. Conception to the Golden Gate bridge. Outputs include SLR scenarios of 0.0, 0.25, 0.5, 0.75, 1.0, 1.5, 2.0, 2.5, 3.0, and 5.0 meters; storm scenarios include background conditions (astronomic spring tide and average atmospheric conditions)...
Categories: Data;
Types: Map Service,
OGC WFS Layer,
OGC WMS Layer,
OGC WMS Service;
Tags: Beaches,
CMHRP,
Central California,
Central California Coast,
Climate change,
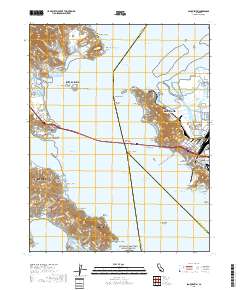
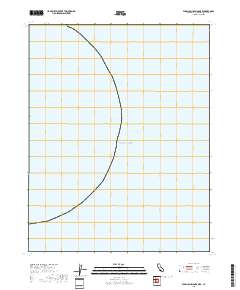
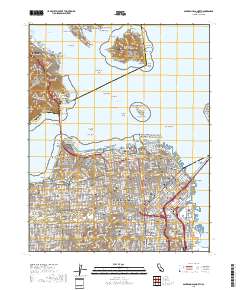
Layered geospatial PDF 7.5 Minute Quadrangle Map. Layers of geospatial data include orthoimagery, roads, grids, geographic names, elevation contours, hydrography, and other selected map features. This map is derived from GIS (geospatial information system) data. It represents a repackaging of GIS data in traditional map form, not creation of new information. The geospatial data in this map are from selected National Map data holdings and other government sources.
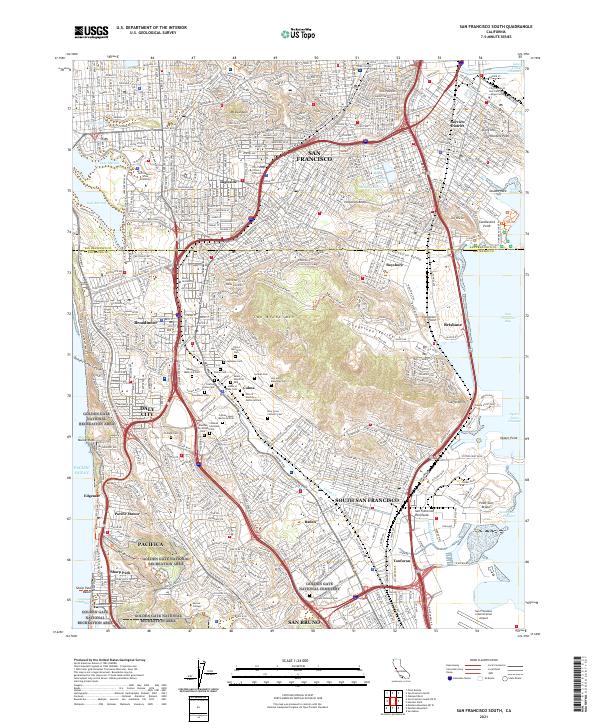
Layered geospatial PDF 7.5 Minute Quadrangle Map. Layers of geospatial data include orthoimagery, roads, grids, geographic names, elevation contours, hydrography, and other selected map features. This map is derived from GIS (geospatial information system) data. It represents a repackaging of GIS data in traditional map form, not creation of new information. The geospatial data in this map are from selected National Map data holdings and other government sources.
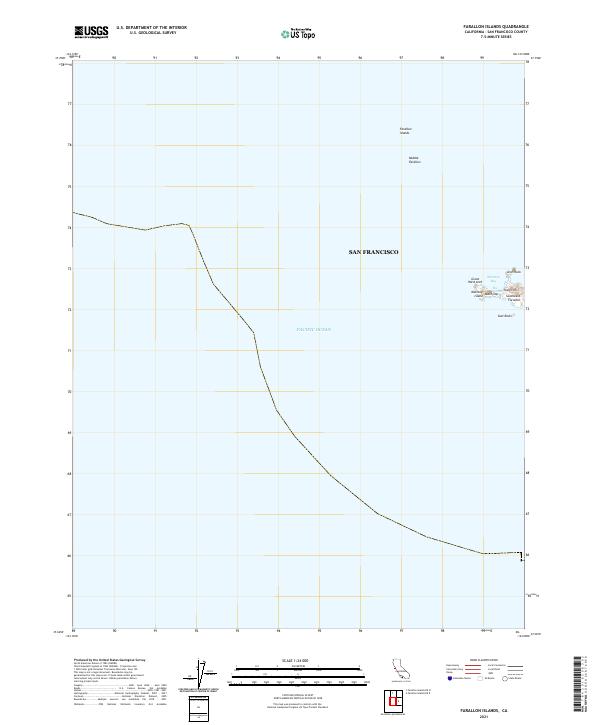
Layered geospatial PDF 7.5 Minute Quadrangle Map. Layers of geospatial data include orthoimagery, roads, grids, geographic names, elevation contours, hydrography, and other selected map features. This map is derived from GIS (geospatial information system) data. It represents a repackaging of GIS data in traditional map form, not creation of new information. The geospatial data in this map are from selected National Map data holdings and other government sources.
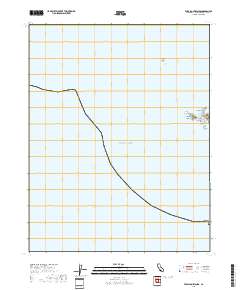
Layered geospatial PDF 7.5 Minute Quadrangle Map. Layers of geospatial data include orthoimagery, roads, grids, geographic names, elevation contours, hydrography, and other selected map features. This map is derived from GIS (geospatial information system) data. It represents a repackaging of GIS data in traditional map form, not creation of new information. The geospatial data in this map are from selected National Map data holdings and other government sources.
Layers of geospatial data include contours, boundaries, land cover, hydrography, roads, transportation, geographic names, structures, and other selected map features.
These datasets supports the conclusions in the journal article entitled "Variations in community evacuation potential related to average return periods in probabilistic tsunami hazard analysis" as described in the abstract below: Tsunami risk management requires strategies that can address multiple sources with different recurrence intervals, wave-arrival times, and inundation extents. Probabilistic tsunami hazard analysis (PTHA) provides a structured way to integrate multiple sources, including the uncertainties due to the natural variability and limited knowledge of sources. PTHA-based products relate to specific average return periods (ARP) and while there has been considerable attention paid to ARP choice for...
Layers of geospatial data include contours, boundaries, land cover, hydrography, roads, transportation, geographic names, structures, and other selected map features.
Layers of geospatial data include contours, boundaries, land cover, hydrography, roads, transportation, geographic names, structures, and other selected map features.
Layers of geospatial data include contours, boundaries, land cover, hydrography, roads, transportation, geographic names, structures, and other selected map features.
Layers of geospatial data include contours, boundaries, land cover, hydrography, roads, transportation, geographic names, structures, and other selected map features.
This data contains model-derived total water levels (in meters) for the sea-level rise (SLR) and storm condition indicated. The Coastal Storm Modeling System (CoSMoS) makes detailed predictions (meter-scale) over large geographic scales (100s of kilometers) of storm-induced coastal flooding and erosion for both current and future sea-level rise (SLR) scenarios. Projections for CoSMoS v3.1 in Central California include flood-hazard information for the coast from Pt. Conception to the Golden Gate bridge. Outputs include SLR scenarios of 0.0, 0.25, 0.5, 0.75, 1.0, 1.5, 2.0, 2.5, 3.0, and 5.0 meters; storm scenarios include background conditions (astronomic spring tide and average atmospheric conditions) and simulated...
Categories: Data;
Types: Map Service,
OGC WFS Layer,
OGC WMS Layer,
OGC WMS Service;
Tags: Beaches,
CMHRP,
Central California,
Central California Coast,
Climate change,
Layered geospatial PDF 7.5 Minute Quadrangle Map. Layers of geospatial data include orthoimagery, roads, grids, geographic names, elevation contours, hydrography, and other selected map features. This map is derived from GIS (geospatial information system) data. It represents a repackaging of GIS data in traditional map form, not creation of new information. The geospatial data in this map are from selected National Map data holdings and other government sources.
Layered geospatial PDF 7.5 Minute Quadrangle Map. Layers of geospatial data include orthoimagery, roads, grids, geographic names, elevation contours, hydrography, and other selected map features. This map is derived from GIS (geospatial information system) data. It represents a repackaging of GIS data in traditional map form, not creation of new information. The geospatial data in this map are from selected National Map data holdings and other government sources.
Layers of geospatial data include contours, boundaries, land cover, hydrography, roads, transportation, geographic names, structures, and other selected map features.
Layers of geospatial data include contours, boundaries, land cover, hydrography, roads, transportation, geographic names, structures, and other selected map features.
Layers of geospatial data include contours, boundaries, land cover, hydrography, roads, transportation, geographic names, structures, and other selected map features.
|

|
