Filters: Tags: San Joaquin County (X)
212 results (52ms)|
Filters
Date Range
Extensions Types Contacts
Categories Tag Types Tag Schemes |
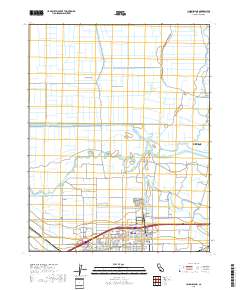
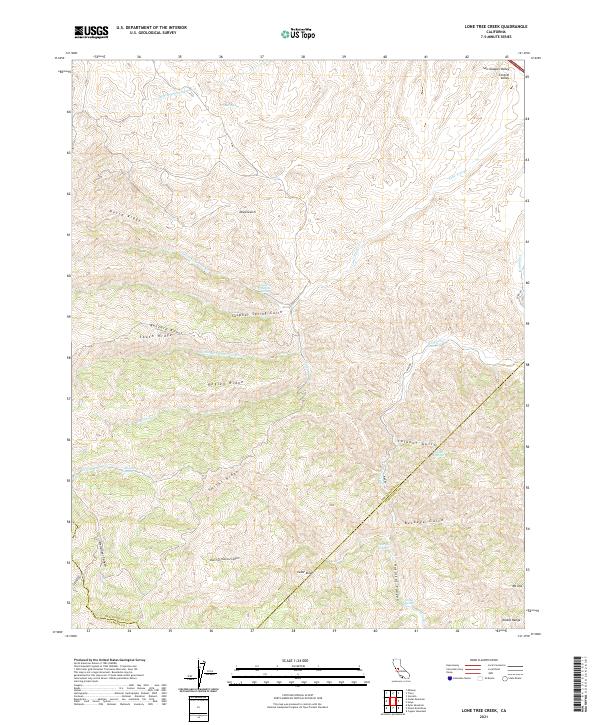
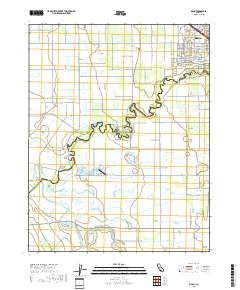
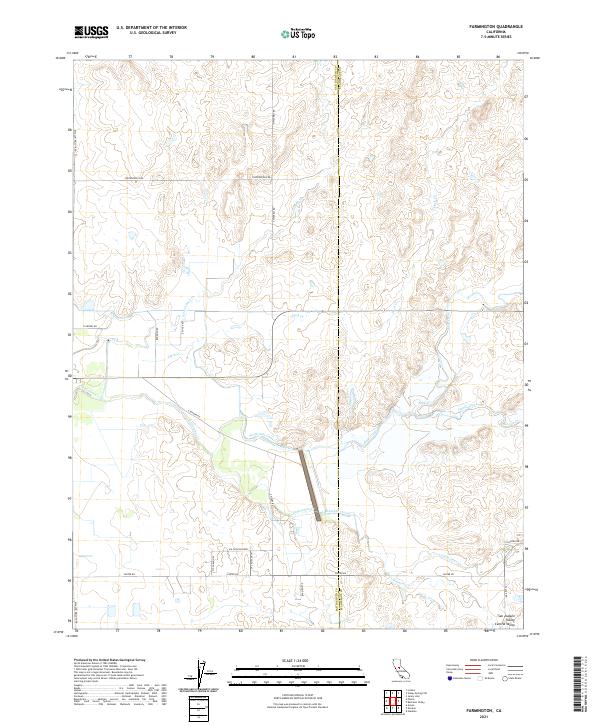
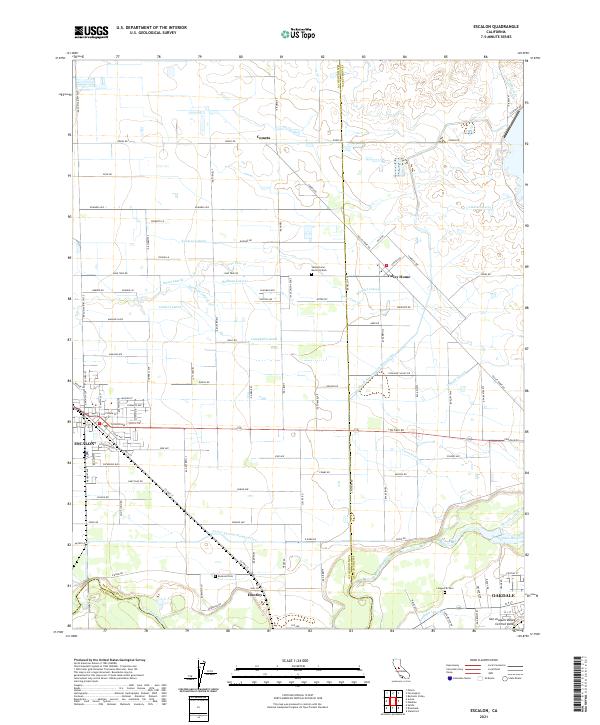
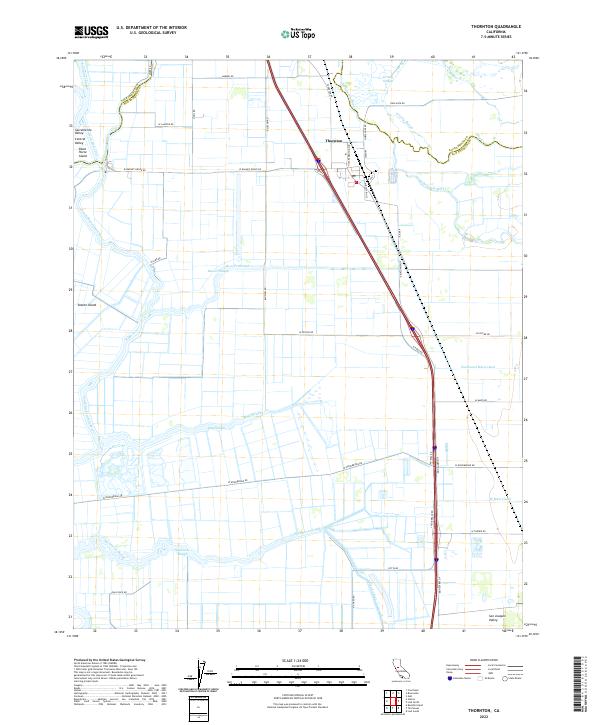
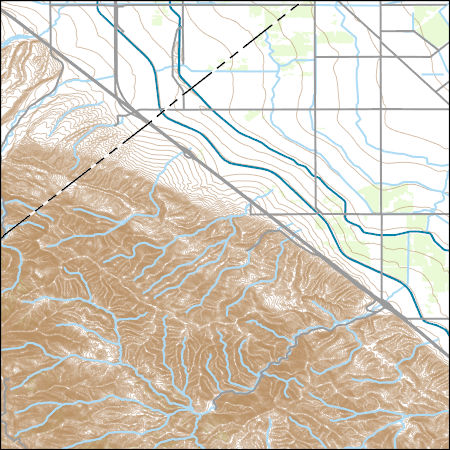
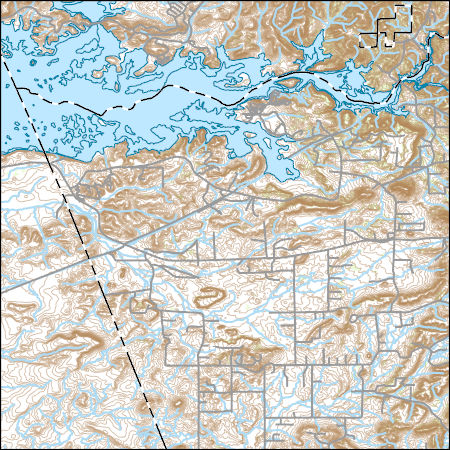
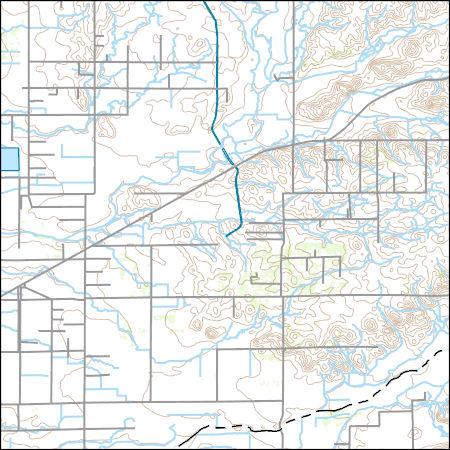
Layered geospatial PDF 7.5 Minute Quadrangle Map. Layers of geospatial data include orthoimagery, roads, grids, geographic names, elevation contours, hydrography, and other selected map features. This map is derived from GIS (geospatial information system) data. It represents a repackaging of GIS data in traditional map form, not creation of new information. The geospatial data in this map are from selected National Map data holdings and other government sources.
Layered geospatial PDF 7.5 Minute Quadrangle Map. Layers of geospatial data include orthoimagery, roads, grids, geographic names, elevation contours, hydrography, and other selected map features. This map is derived from GIS (geospatial information system) data. It represents a repackaging of GIS data in traditional map form, not creation of new information. The geospatial data in this map are from selected National Map data holdings and other government sources.
Layered geospatial PDF 7.5 Minute Quadrangle Map. Layers of geospatial data include orthoimagery, roads, grids, geographic names, elevation contours, hydrography, and other selected map features. This map is derived from GIS (geospatial information system) data. It represents a repackaging of GIS data in traditional map form, not creation of new information. The geospatial data in this map are from selected National Map data holdings and other government sources.
Layered geospatial PDF 7.5 Minute Quadrangle Map. Layers of geospatial data include orthoimagery, roads, grids, geographic names, elevation contours, hydrography, and other selected map features. This map is derived from GIS (geospatial information system) data. It represents a repackaging of GIS data in traditional map form, not creation of new information. The geospatial data in this map are from selected National Map data holdings and other government sources.
Layered geospatial PDF 7.5 Minute Quadrangle Map. Layers of geospatial data include orthoimagery, roads, grids, geographic names, elevation contours, hydrography, and other selected map features. This map is derived from GIS (geospatial information system) data. It represents a repackaging of GIS data in traditional map form, not creation of new information. The geospatial data in this map are from selected National Map data holdings and other government sources.
Layered geospatial PDF 7.5 Minute Quadrangle Map. Layers of geospatial data include orthoimagery, roads, grids, geographic names, elevation contours, hydrography, and other selected map features. This map is derived from GIS (geospatial information system) data. It represents a repackaging of GIS data in traditional map form, not creation of new information. The geospatial data in this map are from selected National Map data holdings and other government sources.
Layered geospatial PDF 7.5 Minute Quadrangle Map. Layers of geospatial data include orthoimagery, roads, grids, geographic names, elevation contours, hydrography, and other selected map features. This map is derived from GIS (geospatial information system) data. It represents a repackaging of GIS data in traditional map form, not creation of new information. The geospatial data in this map are from selected National Map data holdings and other government sources.
Layered geospatial PDF 7.5 Minute Quadrangle Map. Layers of geospatial data include orthoimagery, roads, grids, geographic names, elevation contours, hydrography, and other selected map features. This map is derived from GIS (geospatial information system) data. It represents a repackaging of GIS data in traditional map form, not creation of new information. The geospatial data in this map are from selected National Map data holdings and other government sources.

These data were released prior to the October 1, 2016 effective date for the USGS’s policy dictating the review, approval, and release of scientific data as referenced in USGS Survey Manual Chapter 502.8 Fundamental Science Practices: Review and Approval of Scientific Data for Release. This digital dataset defines the spring 1961 water-table altitude for the California's Central Valley. It was used to initiate the water-level altitudes for the upper zones of the transient hydrologic model of the Central Valley flow system. The Central Valley encompasses an approximate 50,000 square-kilometer region of California. The complex hydrologic system of the Central Valley is simulated using the USGS numerical modeling...

These data were released prior to the October 1, 2016 effective date for the USGS’s policy dictating the review, approval, and release of scientific data as referenced in USGS Survey Manual Chapter 502.8 Fundamental Science Practices: Review and Approval of Scientific Data for Release. This digital dataset defines the depth of the Corcoran Clay Member of the Tulare Formation. The complex hydrologic system of the Central Valley is simulated using the USGS numerical modeling code MODFLOW-FMP (Schmid and others, 2006b). This simulation is referred to here as the Central Valley Hydrologic Model (CVHM) (Faunt, 2009). Utilizing MODFLOW-FMP, the CVHM simulates groundwater and surface-water flow, irrigated agriculture,...

These data were released prior to the October 1, 2016 effective date for the USGS’s policy dictating the review, approval, and release of scientific data as referenced in USGS Survey Manual Chapter 502.8 Fundamental Science Practices: Review and Approval of Scientific Data for Release. This digital dataset defines the model grid and altitudes of the top of the 10 model layers and base of the model simulated in the transient hydrologic model of the Central Valley flow system. The Central Valley encompasses an approximate 50,000 square-kilometer region of California. The complex hydrologic system of the Central Valley is simulated using the USGS numerical modeling code MODFLOW-FMP (Schmid and others, 2006), which...

These data were released prior to the October 1, 2016 effective date for the USGS’s policy dictating the review, approval, and release of scientific data as referenced in USGS Survey Manual Chapter 502.8 Fundamental Science Practices: Review and Approval of Scientific Data for Release. This digital dataset contains the surface-water network for the Central Valley Hydrologic Model (CVHM). The Central Valley encompasses an approximate 50,000-square-kilometer region of California. The complex hydrologic system of the Central Valley is simulated using the USGS numerical modeling code MODFLOW-FMP (Schmid and others, 2006). This simulation is referred to here as the CVHM (Faunt, 2009). Utilizing MODFLOW-FMP, the CVHM...
Bathymetric change grids covering the periods of time from 1934 to 2011, from 2011 to 2018, and from 1934 to 2018 are presented. The grids cover a portion of the Mokelumne River, California, starting at its terminus at the San Joaquin River and moving upriver to the confluences of the north and south branches of the Mokelumne. Positive grid values indicate accretion, or a shallowing of the surface bathymetric surface, and negative grid values indicate erosion, or a deepening of the bathymetric surface. Bathymetry data sources include the U.S. Geological Survey, California Department of Water Resources, and NOAA's National Ocean Service.
Categories: Data;
Types: Downloadable,
GeoTIFF,
Map Service,
Raster;
Tags: Andrus Island,
Bathymetry and Elevation,
Bouldin Island,
CMHRP,
California,
This data release is currently being revised and is temporarily unavailable. Please contact rhkent@usgs.gov with any immediate requests. The U.S. Geological Survey Groundwater Ambient Monitoring and Assessment-Priority Basin Project (USGS GAMA-PBP) collected samples to be analyzed for per-and polyfluoroalkyl substances (PFAS) from domestic and public supply wells from May 2019 to September 2020. The datasets presented here include identification of the 28 PFAS constituents monitored by the project, Identification and brief characterization of the 211 GAMA-PBP wells for which samples were analyzed for PFAS during the study period, and analytical results for those groundwater samples, along with results for quality...
Categories: Data;
Tags: California,
Colusa County,
Environmental Health,
Geochemistry,
Humboldt County,
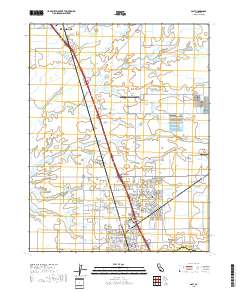
Layers of geospatial data include contours, boundaries, land cover, hydrography, roads, transportation, geographic names, structures, and other selected map features.
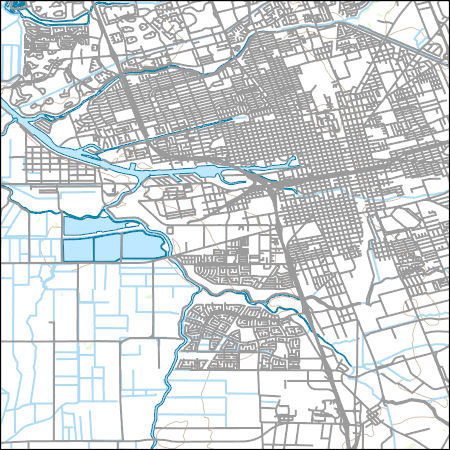
Layers of geospatial data include contours, boundaries, land cover, hydrography, roads, transportation, geographic names, structures, and other selected map features.
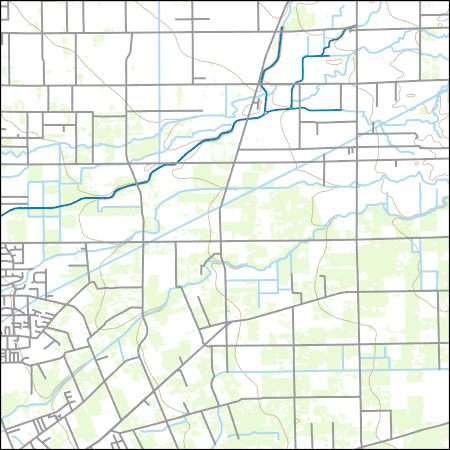
Layers of geospatial data include contours, boundaries, land cover, hydrography, roads, transportation, geographic names, structures, and other selected map features.
USGS Topo Map Vector Data (Vector) 72698 Wallace, California 20220508 for 7.5 x 7.5 minute Shapefile
Layers of geospatial data include contours, boundaries, land cover, hydrography, roads, transportation, geographic names, structures, and other selected map features.
Layers of geospatial data include contours, boundaries, land cover, hydrography, roads, transportation, geographic names, structures, and other selected map features.
Layered geospatial PDF 7.5 Minute Quadrangle Map. Layers of geospatial data include orthoimagery, roads, grids, geographic names, elevation contours, hydrography, and other selected map features. This map is derived from GIS (geospatial information system) data. It represents a repackaging of GIS data in traditional map form, not creation of new information. The geospatial data in this map are from selected National Map data holdings and other government sources.
|

|
