Filters: Tags: San Mateo County (X) > partyWithName: U.S. Geological Survey (X)
89 results (62ms)|
Filters
Date Range
Extensions Types Contacts
Categories Tag Types Tag Schemes |
This dataset consists of point cloud data collected in 2016 and 2017 of the lower and upper Scenic Drive landslide locations in La Honda, California. Point cloud data were collected in 2016 to establish baseline for movement detection of past landslides. Point cloud data were collected in 2017 adjacent and upslope of 2016 data to document a newly formed landslide. The data were collected with a Riegl VZ400 Terrestrial Laser Scanner and georeferenced using a Leica Viva GS15 survey grade GPS. The data are delivered as georeferenced (NAD83 UTM zone 10N ellipsoid) classified point clouds, 5 cm resolution digital elevation models, and a text file of surveyed GPS control points. The included files are: LH2017_Jan.laz...
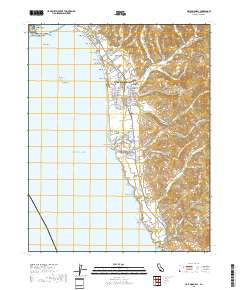
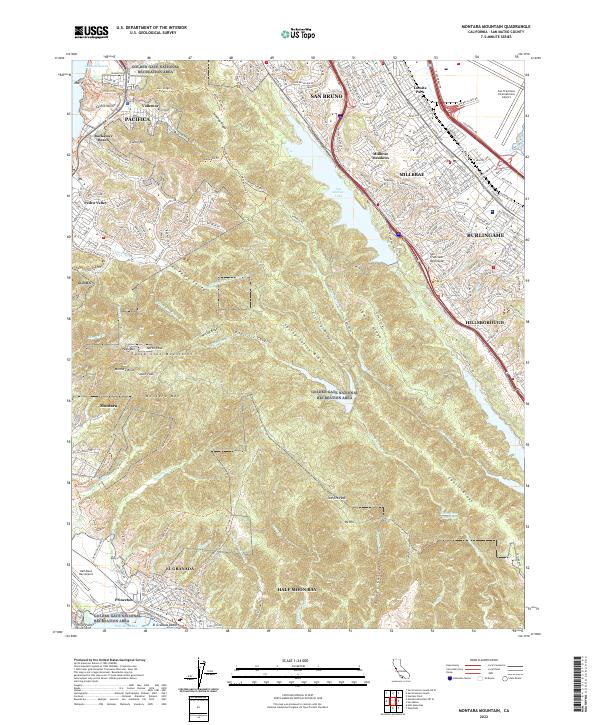
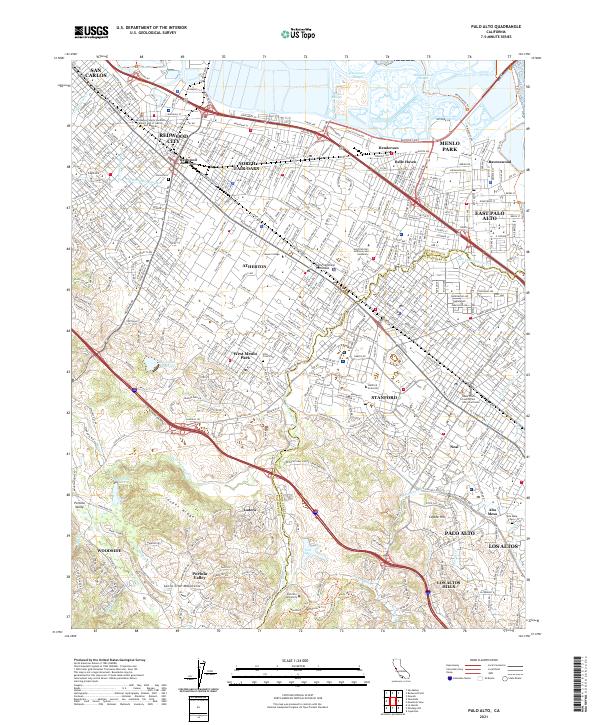
Layered geospatial PDF 7.5 Minute Quadrangle Map. Layers of geospatial data include orthoimagery, roads, grids, geographic names, elevation contours, hydrography, and other selected map features. This map is derived from GIS (geospatial information system) data. It represents a repackaging of GIS data in traditional map form, not creation of new information. The geospatial data in this map are from selected National Map data holdings and other government sources.
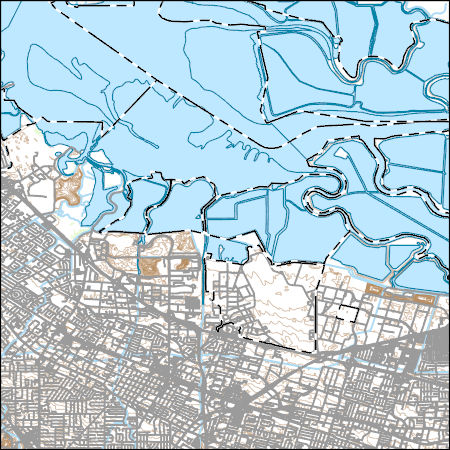
This part of DS 781 presents data for the sediment-thickness map of the Pigeon Point to Monterey, California, map region. The raster data file is included in "SedimentThickness_PigeonPointToMontereyBay.zip," which is accessible from https://doi.org/10.5066/F7N29V0Z. As part of the USGS's California State Waters Mapping Project, a 50-m-resolution grid of sediment thickness for the seafloor within the limit of California’s State Waters between Pigeon Point and southern Monterey Bay was generated from seismic-reflection data collected in 2009, 2010, and 2011 (USGS activities (S-15-10-NC, S-N1-09-MB, and S-06-11-MB) supplemented with outcrop and geologic structure from DS 781. Isopach contours at 2.5-meter intervals...
Categories: Data;
Types: Downloadable,
GeoTIFF,
Map Service,
Raster;
Tags: Ano Nuevo,
Aptos,
Distributions,
Marina,
Monterey,
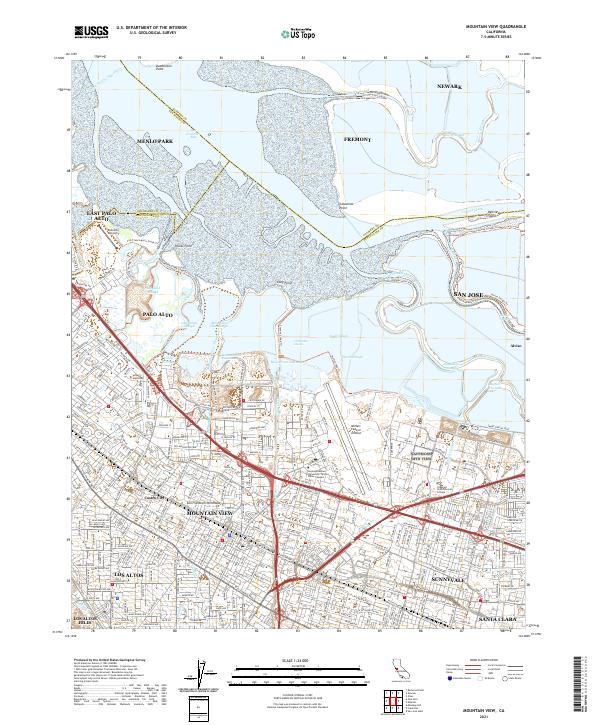
Layered geospatial PDF 7.5 Minute Quadrangle Map. Layers of geospatial data include orthoimagery, roads, grids, geographic names, elevation contours, hydrography, and other selected map features. This map is derived from GIS (geospatial information system) data. It represents a repackaging of GIS data in traditional map form, not creation of new information. The geospatial data in this map are from selected National Map data holdings and other government sources.
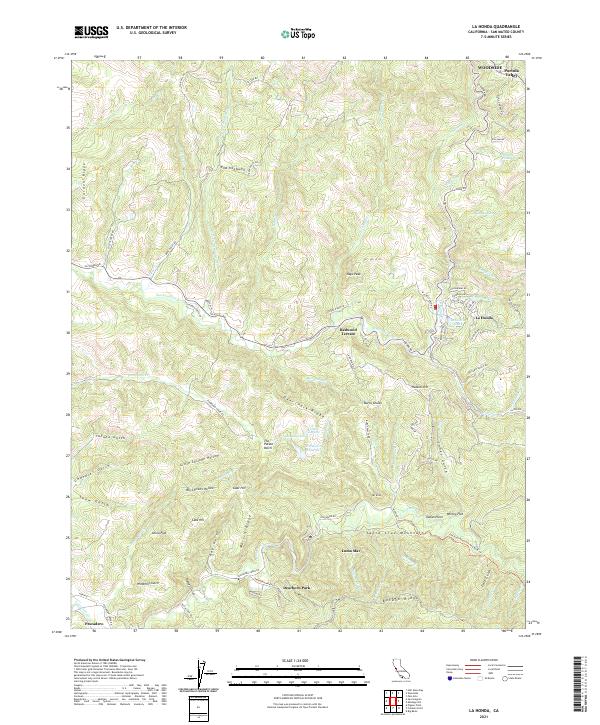
Layered geospatial PDF 7.5 Minute Quadrangle Map. Layers of geospatial data include orthoimagery, roads, grids, geographic names, elevation contours, hydrography, and other selected map features. This map is derived from GIS (geospatial information system) data. It represents a repackaging of GIS data in traditional map form, not creation of new information. The geospatial data in this map are from selected National Map data holdings and other government sources.
Layered geospatial PDF 7.5 Minute Quadrangle Map. Layers of geospatial data include orthoimagery, roads, grids, geographic names, elevation contours, hydrography, and other selected map features. This map is derived from GIS (geospatial information system) data. It represents a repackaging of GIS data in traditional map form, not creation of new information. The geospatial data in this map are from selected National Map data holdings and other government sources.
Layers of geospatial data include contours, boundaries, land cover, hydrography, roads, transportation, geographic names, structures, and other selected map features.
Layers of geospatial data include contours, boundaries, land cover, hydrography, roads, transportation, geographic names, structures, and other selected map features.
This part of DS 781 presents data for the sediment-thickness isopachs for the Pigeon Point to Monterey Bay, California, map region. The vector data file is included in "Isopachs_PigeonPointToMonterey.zip," which is accessible from https://doi.org/10.5066/F7N29V0Z. As part of the USGS's California State Waters Mapping Project, a 50-m-resolution grid of sediment thickness for the seafloor within the limit of California’s State Waters between Pigeon Point and southern Monterey Bay was generated from seismic-reflection data collected in 2009, 2010, and 2011 (USGS activities (S-15-10-NC, S-N1-09-MB, and S-06-11-MB) supplemented with outcrop and geologic structure from DS 781. Isopach contours at 2.5-meter intervals were...
Categories: Data;
Types: Downloadable,
Map Service,
OGC WFS Layer,
OGC WMS Layer,
Shapefile;
Tags: Ano Nuevo,
Aptos,
Distributions,
Marina,
Monterey,
Layered geospatial PDF 7.5 Minute Quadrangle Map. Layers of geospatial data include orthoimagery, roads, grids, geographic names, elevation contours, hydrography, and other selected map features. This map is derived from GIS (geospatial information system) data. It represents a repackaging of GIS data in traditional map form, not creation of new information. The geospatial data in this map are from selected National Map data holdings and other government sources.
Layered geospatial PDF 7.5 Minute Quadrangle Map. Layers of geospatial data include orthoimagery, roads, grids, geographic names, elevation contours, hydrography, and other selected map features. This map is derived from GIS (geospatial information system) data. It represents a repackaging of GIS data in traditional map form, not creation of new information. The geospatial data in this map are from selected National Map data holdings and other government sources.
Layered geospatial PDF 7.5 Minute Quadrangle Map. Layers of geospatial data include orthoimagery, roads, grids, geographic names, elevation contours, hydrography, and other selected map features. This map is derived from GIS (geospatial information system) data. It represents a repackaging of GIS data in traditional map form, not creation of new information. The geospatial data in this map are from selected National Map data holdings and other government sources.
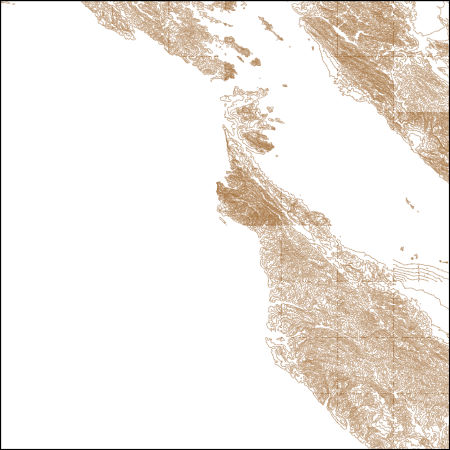
These vector contour lines are derived from the 3D Elevation Program using automated and semi-automated processes. They were created to support 1:24,000-scale CONUS and Hawaii, 1:25,000-scale Alaska, and 1:20,000-scale Puerto Rico / US Virgin Island topographic map products, but are also published in this GIS vector format. Contour intervals are assigned by 7.5-minute quadrangle, so this vector dataset is not visually seamless across quadrangle boundaries. The vector lines have elevation attributes (in feet above mean sea level on NAVD88), but this dataset does not carry line symbols or annotation.
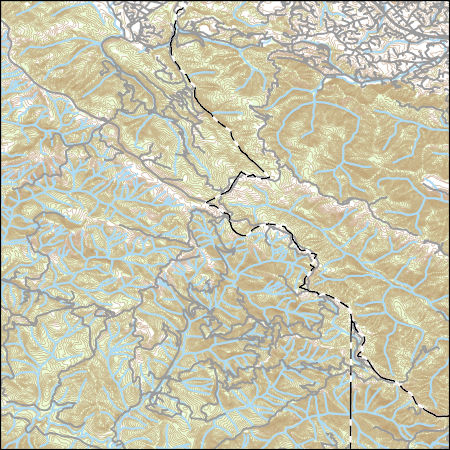
Layers of geospatial data include contours, boundaries, land cover, hydrography, roads, transportation, geographic names, structures, and other selected map features.
Layers of geospatial data include contours, boundaries, land cover, hydrography, roads, transportation, geographic names, structures, and other selected map features.
Layers of geospatial data include contours, boundaries, land cover, hydrography, roads, transportation, geographic names, structures, and other selected map features.
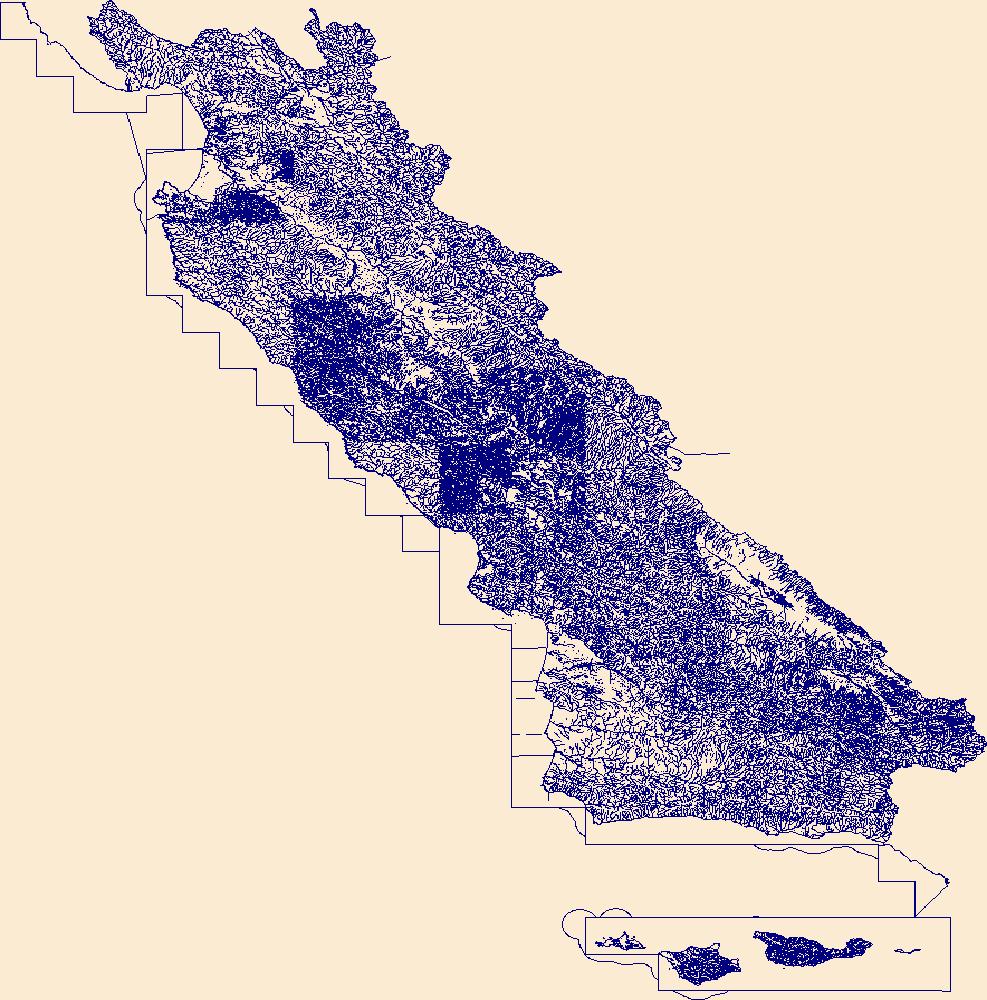
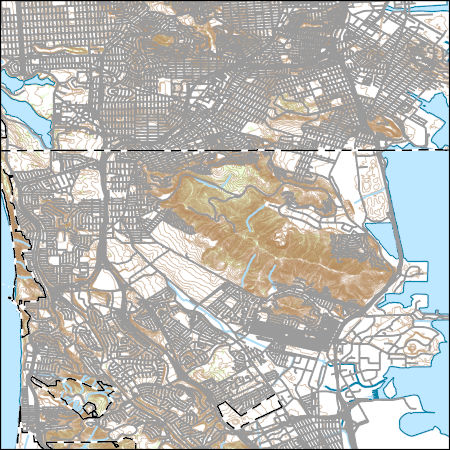
The High Resolution National Hydrography Dataset Plus (NHDPlus HR) is an integrated set of geospatial data layers, including the best available National Hydrography Dataset (NHD), the 10-meter 3D Elevation Program Digital Elevation Model (3DEP DEM), and the National Watershed Boundary Dataset (WBD). The NHDPlus HR combines the NHD, 3DEP DEMs, and WBD to create a stream network with linear referencing, feature naming, "value added attributes" (VAAs), elevation-derived catchments, and other features for hydrologic data analysis. The stream network with linear referencing is a system of data relationships applied to hydrographic systems so that one stream reach "flows" into another and "events" can be tied to and traced...
This part of DS 781 presents data for the transgressive contours for the depth-to-transition map of the Pigeon Point to Monterey, California, map region. The vector file is included in T "TransgressiveContours_PigeonPointToMonterey.zip," which is accessible from https://doi.org/10.5066/F7N29V0Z. As part of the USGS's California State Waters Mapping Project, a 50-m grid of sediment thickness for the seafloor within the limit of California’s State Waters between Pigeon Point and southern Monterey Bay was generated from seismic-reflection data collected in 2009 and 2010 (USGS activities (S-15-10-NC, S-N1-09-MB, and S-06-11-MB) supplemented with outcrop and geologic structure from DS 781. The resulting grid covers was...
Categories: Data;
Types: Downloadable,
Map Service,
OGC WFS Layer,
OGC WMS Layer,
Shapefile;
Tags: Ano Nuevo,
Aptos,
Distributions,
Marina,
Monterey,
Layered geospatial PDF 7.5 Minute Quadrangle Map. Layers of geospatial data include orthoimagery, roads, grids, geographic names, elevation contours, hydrography, and other selected map features. This map is derived from GIS (geospatial information system) data. It represents a repackaging of GIS data in traditional map form, not creation of new information. The geospatial data in this map are from selected National Map data holdings and other government sources.
Layered geospatial PDF 7.5 Minute Quadrangle Map. Layers of geospatial data include orthoimagery, roads, grids, geographic names, elevation contours, hydrography, and other selected map features. This map is derived from GIS (geospatial information system) data. It represents a repackaging of GIS data in traditional map form, not creation of new information. The geospatial data in this map are from selected National Map data holdings and other government sources.
|

|
