Filters: Tags: San Mateo County (X)
183 results (127ms)|
Filters
Date Range
Extensions Types Contacts
Categories Tag Types Tag Schemes |
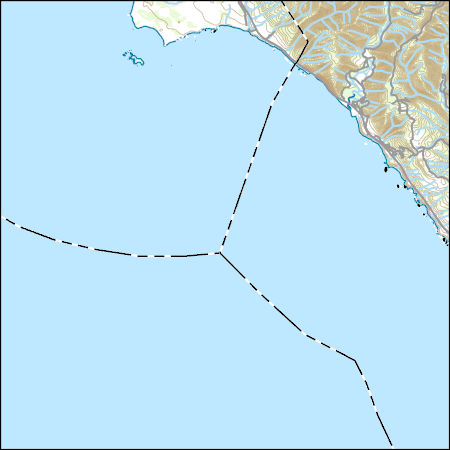
This data contains geographic extents of projected coastal flooding, low-lying vulnerable areas, and maximum/minimum flood potential (flood uncertainty) associated with the sea-level rise (SLR) and storm condition indicated. The Coastal Storm Modeling System (CoSMoS) makes detailed predictions (meter-scale) over large geographic scales (100s of kilometers) of storm-induced coastal flooding and erosion for both current and future sea-level rise (SLR) scenarios. Projections for CoSMoS v3.1 in Central California include flood-hazard information for the coast from Pt. Conception to the Golden Gate bridge. Outputs include SLR scenarios of 0.0, 0.25, 0.5, 0.75, 1.0, 1.5, 2.0, 2.5, 3.0, and 5.0 meters; storm scenarios...
Categories: Data;
Types: Map Service,
OGC WFS Layer,
OGC WMS Layer,
OGC WMS Service;
Tags: Beaches,
CMHRP,
Central California,
Central California Coast,
Climate change,
This data contains maximum model-derived significant wave height (in meters) for the sea-level rise (SLR) and storm condition indicated. The Coastal Storm Modeling System (CoSMoS) makes detailed predictions (meter-scale) over large geographic scales (100s of kilometers) of storm-induced coastal flooding and erosion for both current and future sea-level rise (SLR) scenarios. Projections for CoSMoS v3.1 in Central California include flood-hazard information for the coast from Pt. Conception to the Golden Gate bridge. Outputs include SLR scenarios of 0.0, 0.25, 0.5, 0.75, 1.0, 1.5, 2.0, 2.5, 3.0, and 5.0 meters; storm scenarios include background conditions (astronomic spring tide and average atmospheric conditions)...
Categories: Data;
Types: Map Service,
OGC WFS Layer,
OGC WMS Layer,
OGC WMS Service;
Tags: Beaches,
CMHRP,
Central California,
Central California Coast,
Climate change,
This data contains maximum depth of flooding (cm) in the region landward of the present-day shoreline for the sea-level rise (SLR) and storm condition indicated. The Coastal Storm Modeling System (CoSMoS) makes detailed predictions (meter-scale) over large geographic scales (100s of kilometers) of storm-induced coastal flooding and erosion for both current and future sea-level rise (SLR) scenarios. Projections for CoSMoS v3.1 in Central California include flood-hazard information for the coast from Pt. Conception to the Golden Gate bridge. Outputs include SLR scenarios of 0.0, 0.25, 0.5, 0.75, 1.0, 1.5, 2.0, 2.5, 3.0, and 5.0 meters; storm scenarios include background conditions (astronomic spring tide and average...
Categories: Data;
Types: Map Service,
OGC WFS Layer,
OGC WMS Layer,
OGC WMS Service;
Tags: Beaches,
CMHRP,
Central California,
Central California Coast,
Climate change,
This data contains geographic extents of projected coastal flooding, low-lying vulnerable areas, and maximum/minimum flood potential (flood uncertainty) associated with the sea-level rise (SLR) and storm condition indicated. The Coastal Storm Modeling System (CoSMoS) makes detailed predictions (meter-scale) over large geographic scales (100s of kilometers) of storm-induced coastal flooding and erosion for both current and future sea-level rise (SLR) scenarios. Projections for CoSMoS v3.1 in Central California include flood-hazard information for the coast from Pt. Conception to the Golden Gate bridge. Outputs include SLR scenarios of 0.0, 0.25, 0.5, 0.75, 1.0, 1.5, 2.0, 2.5, 3.0, and 5.0 meters; storm scenarios...
Categories: Data;
Types: Map Service,
OGC WFS Layer,
OGC WMS Layer,
OGC WMS Service;
Tags: Beaches,
CMHRP,
Central California,
Central California Coast,
Climate change,
This data contains maximum model-derived ocean currents (in meters per second) for the sea-level rise (SLR) and storm condition indicated. The Coastal Storm Modeling System (CoSMoS) makes detailed predictions (meter-scale) over large geographic scales (100s of kilometers) of storm-induced coastal flooding and erosion for both current and future sea-level rise (SLR) scenarios. Projections for CoSMoS v3.1 in Central California include flood-hazard information for the coast from Pt. Conception to the Golden Gate bridge. Outputs include SLR scenarios of 0.0, 0.25, 0.5, 0.75, 1.0, 1.5, 2.0, 2.5, 3.0, and 5.0 meters; storm scenarios include background conditions (astronomic spring tide and average atmospheric conditions)...
Categories: Data;
Types: Map Service,
OGC WFS Layer,
OGC WMS Layer,
OGC WMS Service;
Tags: Beaches,
CMHRP,
Central California,
Central California Coast,
Climate change,
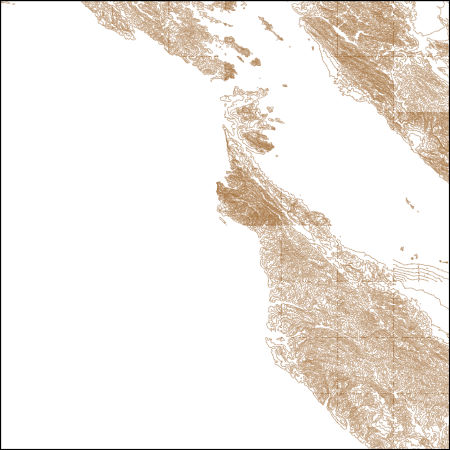
This part of DS 781 presents data for the depth-to-transition map of the Pigeon Point to Monterey, California, map region. The raster data file is included in "DepthToTransition_PigeonPointToMonterey.zip," which is accessible from https://doi.org/10.5066/F7N29V0Z. As part of the USGS's California State Waters Mapping Project, a 50-m grid of sediment thickness for the seafloor within the limit of California’s State Waters between Pigeon Point and southern Monterey Bay was generated from seismic-reflection data collected in 2009 and 2010 (USGS activities (S-15-10-NC, S-N1-09-MB, and S-06-11-MB) supplemented with outcrop and geologic structure from DS 781. The resulting grid covers was subtracted from regional bathymetry...
Categories: Data;
Types: Downloadable,
GeoTIFF,
Map Service,
Raster;
Tags: Ano Nuevo,
Aptos,
Distributions,
Marina,
Monterey,
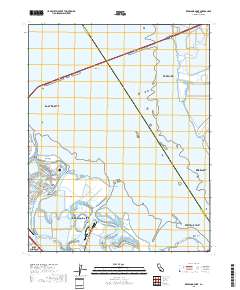
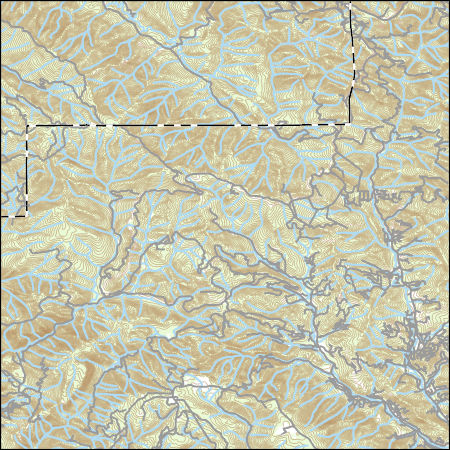
Layered geospatial PDF 7.5 Minute Quadrangle Map. Layers of geospatial data include orthoimagery, roads, grids, geographic names, elevation contours, hydrography, and other selected map features. This map is derived from GIS (geospatial information system) data. It represents a repackaging of GIS data in traditional map form, not creation of new information. The geospatial data in this map are from selected National Map data holdings and other government sources.
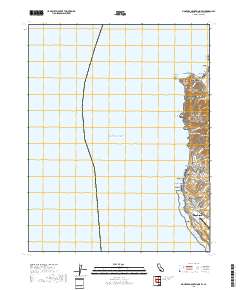
Layered geospatial PDF 7.5 Minute Quadrangle Map. Layers of geospatial data include orthoimagery, roads, grids, geographic names, elevation contours, hydrography, and other selected map features. This map is derived from GIS (geospatial information system) data. It represents a repackaging of GIS data in traditional map form, not creation of new information. The geospatial data in this map are from selected National Map data holdings and other government sources.
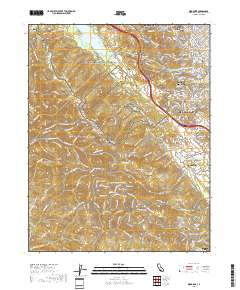
Layered geospatial PDF 7.5 Minute Quadrangle Map. Layers of geospatial data include orthoimagery, roads, grids, geographic names, elevation contours, hydrography, and other selected map features. This map is derived from GIS (geospatial information system) data. It represents a repackaging of GIS data in traditional map form, not creation of new information. The geospatial data in this map are from selected National Map data holdings and other government sources.
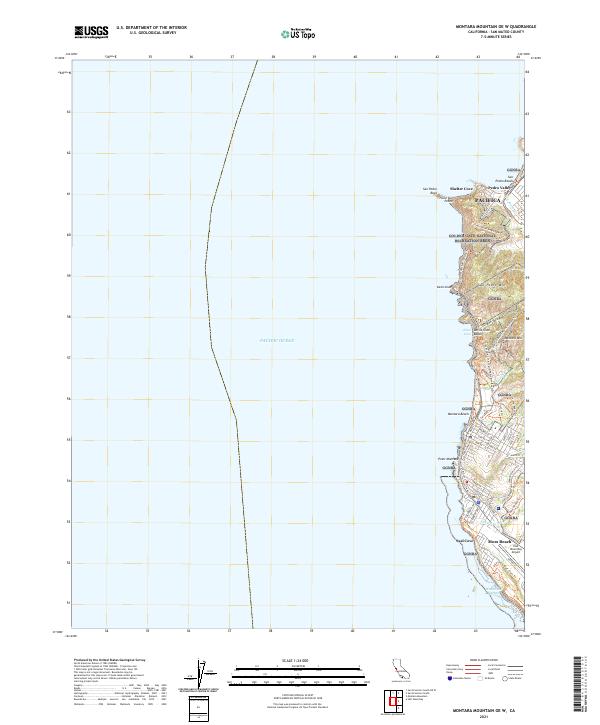
Layered geospatial PDF 7.5 Minute Quadrangle Map. Layers of geospatial data include orthoimagery, roads, grids, geographic names, elevation contours, hydrography, and other selected map features. This map is derived from GIS (geospatial information system) data. It represents a repackaging of GIS data in traditional map form, not creation of new information. The geospatial data in this map are from selected National Map data holdings and other government sources.
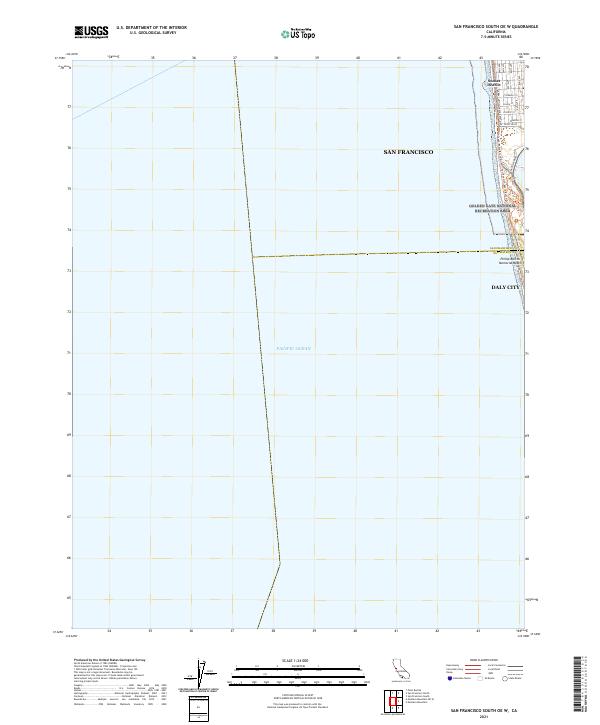
Layered geospatial PDF 7.5 Minute Quadrangle Map. Layers of geospatial data include orthoimagery, roads, grids, geographic names, elevation contours, hydrography, and other selected map features. This map is derived from GIS (geospatial information system) data. It represents a repackaging of GIS data in traditional map form, not creation of new information. The geospatial data in this map are from selected National Map data holdings and other government sources.
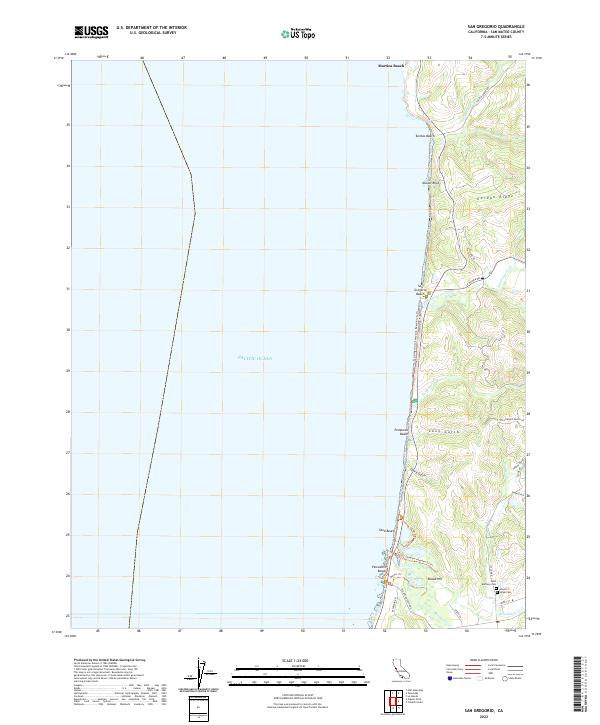
Layered geospatial PDF 7.5 Minute Quadrangle Map. Layers of geospatial data include orthoimagery, roads, grids, geographic names, elevation contours, hydrography, and other selected map features. This map is derived from GIS (geospatial information system) data. It represents a repackaging of GIS data in traditional map form, not creation of new information. The geospatial data in this map are from selected National Map data holdings and other government sources.
Layered geospatial PDF 7.5 Minute Quadrangle Map. Layers of geospatial data include orthoimagery, roads, grids, geographic names, elevation contours, hydrography, and other selected map features. This map is derived from GIS (geospatial information system) data. It represents a repackaging of GIS data in traditional map form, not creation of new information. The geospatial data in this map are from selected National Map data holdings and other government sources.
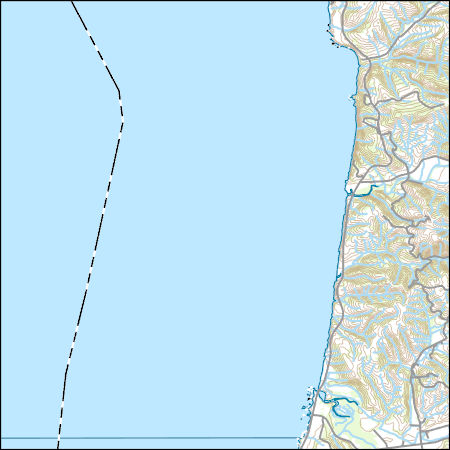
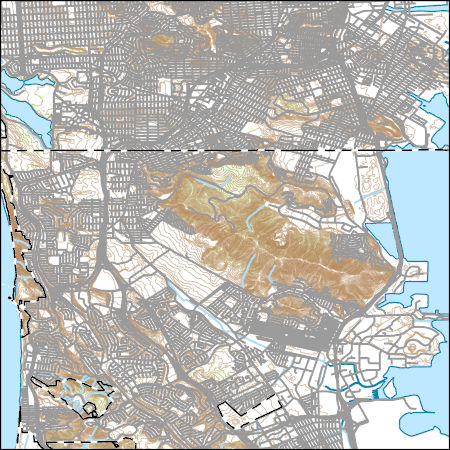
Layers of geospatial data include contours, boundaries, land cover, hydrography, roads, transportation, geographic names, structures, and other selected map features.
Layers of geospatial data include contours, boundaries, land cover, hydrography, roads, transportation, geographic names, structures, and other selected map features.
These vector contour lines are derived from the 3D Elevation Program using automated and semi-automated processes. They were created to support 1:24,000-scale CONUS and Hawaii, 1:25,000-scale Alaska, and 1:20,000-scale Puerto Rico / US Virgin Island topographic map products, but are also published in this GIS vector format. Contour intervals are assigned by 7.5-minute quadrangle, so this vector dataset is not visually seamless across quadrangle boundaries. The vector lines have elevation attributes (in feet above mean sea level on NAVD88), but this dataset does not carry line symbols or annotation.

Layers of geospatial data include contours, boundaries, land cover, hydrography, roads, transportation, geographic names, structures, and other selected map features.
Layers of geospatial data include contours, boundaries, land cover, hydrography, roads, transportation, geographic names, structures, and other selected map features.
Layers of geospatial data include contours, boundaries, land cover, hydrography, roads, transportation, geographic names, structures, and other selected map features.
This data contains geographic extents of projected coastal flooding, low-lying vulnerable areas, and maximum/minimum flood potential (flood uncertainty) associated with the sea-level rise (SLR) and storm condition indicated. The Coastal Storm Modeling System (CoSMoS) makes detailed predictions (meter-scale) over large geographic scales (100s of kilometers) of storm-induced coastal flooding and erosion for both current and future sea-level rise (SLR) scenarios. Projections for CoSMoS v3.1 in Central California include flood-hazard information for the coast from Pt. Conception to the Golden Gate bridge. Outputs include SLR scenarios of 0.0, 0.25, 0.5, 0.75, 1.0, 1.5, 2.0, 2.5, 3.0, and 5.0 meters; storm scenarios...
Categories: Data;
Types: Map Service,
OGC WFS Layer,
OGC WMS Layer,
OGC WMS Service;
Tags: Beaches,
CMHRP,
Central California,
Central California Coast,
Climate change,
|

|
