Filters: Tags: Sandoval County (X)
242 results (46ms)|
Filters
Date Range
Extensions (Less) Types (Less)
Contacts (Less)
Categories (Less) Tag Types
|
The 'Don Evans Claims (Sandoval County)' file is part of the Grover Heinrichs mining collection. Grover was the Vice President of Heinrichs GEOEXploration, located in Tucson, Arizona. The collection contains over 1,400 folders including economic geology reports, maps, photos, correspondence, drill logs and other related materials. The focus of much of the information is on the western United States, particularly Arizona, but the collection also includes files on mining activity throughout the United States, foreign countries, and 82 mineral commodities.
Categories: Data;
Tags: Dataset,
New Mexico,
Sandoval County,
United States,
geoscientificInformation,
RITO DE LOS FRIJOLES IN BANDELIER NAT MON, NM
RITO DE LOS FRIJOLES IN BANDELIER NAT MON, NM
RITO DE LOS FRIJOLES IN BANDELIER NAT MON, NM
RITO DE LOS FRIJOLES IN BANDELIER NAT MON, NM
RITO DE LOS FRIJOLES IN BANDELIER NAT MON, NM
RITO DE LOS FRIJOLES IN BANDELIER NAT MON, NM
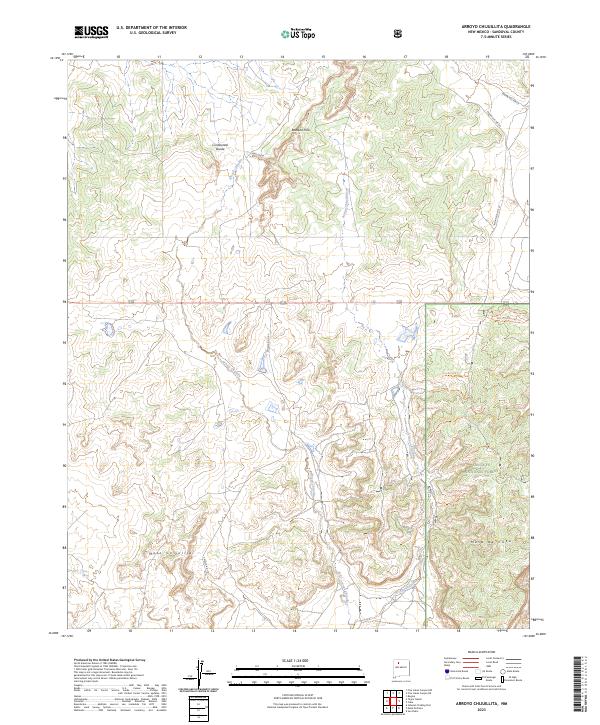
Layered geospatial PDF 7.5 Minute Quadrangle Map. Layers of geospatial data include orthoimagery, roads, grids, geographic names, elevation contours, hydrography, and other selected map features. This map is derived from GIS (geospatial information system) data. It represents a repackaging of GIS data in traditional map form, not creation of new information. The geospatial data in this map are from selected National Map data holdings and other government sources.
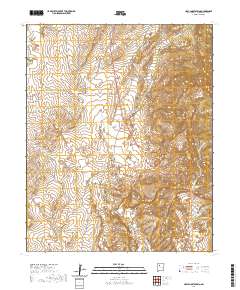
Layered geospatial PDF 7.5 Minute Quadrangle Map. Layers of geospatial data include orthoimagery, roads, grids, geographic names, elevation contours, hydrography, and other selected map features. This map is derived from GIS (geospatial information system) data. It represents a repackaging of GIS data in traditional map form, not creation of new information. The geospatial data in this map are from selected National Map data holdings and other government sources.
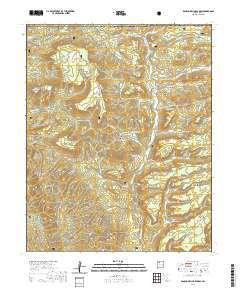
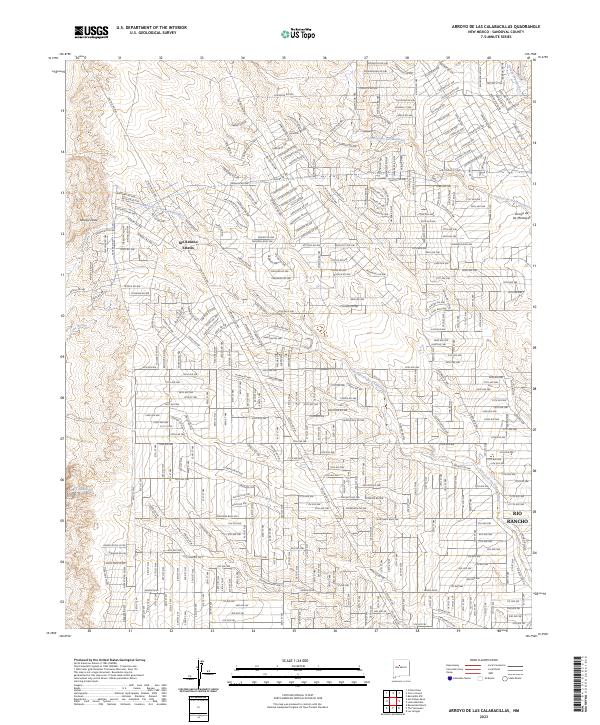
Layered geospatial PDF 7.5 Minute Quadrangle Map. Layers of geospatial data include orthoimagery, roads, grids, geographic names, elevation contours, hydrography, and other selected map features. This map is derived from GIS (geospatial information system) data. It represents a repackaging of GIS data in traditional map form, not creation of new information. The geospatial data in this map are from selected National Map data holdings and other government sources.
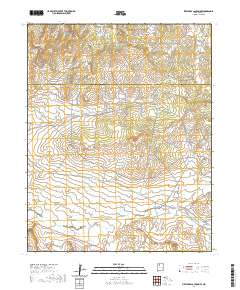
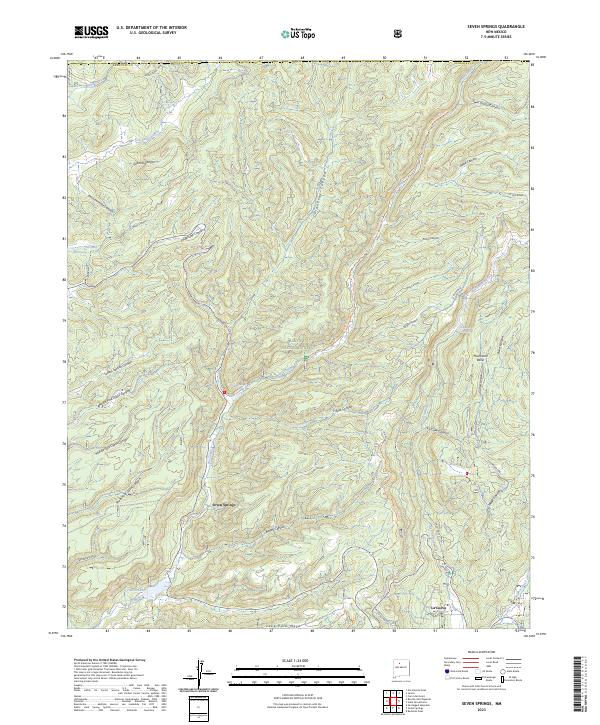
Layered geospatial PDF 7.5 Minute Quadrangle Map. Layers of geospatial data include orthoimagery, roads, grids, geographic names, elevation contours, hydrography, and other selected map features. This map is derived from GIS (geospatial information system) data. It represents a repackaging of GIS data in traditional map form, not creation of new information. The geospatial data in this map are from selected National Map data holdings and other government sources.
This part of the Data Release contains the raster representation of the water-level altitude and water-level change maps developed every 5 years from 1980-2015 for the upper Rio Grande Focus Area Study. The input point data used to generate the water-level altitude maps can be found in the "Groundwater level measurement data used to develop water-level altitude maps in the upper Rio Grande Alluvial Basins" child item of this data release. These digital data accompany Houston, N.A., Thomas, J.V., Foster, L.K., Pedraza, D.E., and Welborn, T.L., 2020, Hydrogeologic framework, groundwater-level altitudes, groundwater-level changes, and groundwater-storage changes in selected alluvial basins of the upper Rio Grande...
Types: Map Service,
OGC WFS Layer,
OGC WMS Layer,
OGC WMS Service;
Tags: Abiquiu Reservoir,
Ahumada,
Alamosa,
Alamosa County,
Alamosa Creek,
This dataset includes the magnetotelluric (MT) sounding data collected in 2007 in and near the San Luis Valley, Colorado. The U.S. Geological Survey conducted a series of multidisciplinary studies, including MT surveys, in the San Luis Valley to improve understanding of the hydrogeology of the Santa Fe Group and the nature of the sedimentary deposits comprising the principal groundwater aquifers of the Rio Grande rift. The shallow unconfined and the deeper confined Santa Fe Group aquifers in the San Luis Basin are the main sources of municipal water for the region. The population of the San Luis Valley region is growing rapidly and water shortfalls could have serious consequences. Future growth and land management...
Layered geospatial PDF 7.5 Minute Quadrangle Map. Layers of geospatial data include orthoimagery, roads, grids, geographic names, elevation contours, hydrography, and other selected map features. This map is derived from GIS (geospatial information system) data. It represents a repackaging of GIS data in traditional map form, not creation of new information. The geospatial data in this map are from selected National Map data holdings and other government sources.
Layered geospatial PDF 7.5 Minute Quadrangle Map. Layers of geospatial data include orthoimagery, roads, grids, geographic names, elevation contours, hydrography, and other selected map features. This map is derived from GIS (geospatial information system) data. It represents a repackaging of GIS data in traditional map form, not creation of new information. The geospatial data in this map are from selected National Map data holdings and other government sources.
Layered geospatial PDF 7.5 Minute Quadrangle Map. Layers of geospatial data include orthoimagery, roads, grids, geographic names, elevation contours, hydrography, and other selected map features. This map is derived from GIS (geospatial information system) data. It represents a repackaging of GIS data in traditional map form, not creation of new information. The geospatial data in this map are from selected National Map data holdings and other government sources.
Layered geospatial PDF 7.5 Minute Quadrangle Map. Layers of geospatial data include orthoimagery, roads, grids, geographic names, elevation contours, hydrography, and other selected map features. This map is derived from GIS (geospatial information system) data. It represents a repackaging of GIS data in traditional map form, not creation of new information. The geospatial data in this map are from selected National Map data holdings and other government sources.
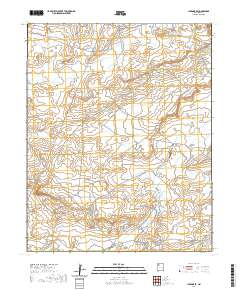
Layered geospatial PDF 7.5 Minute Quadrangle Map. Layers of geospatial data include orthoimagery, roads, grids, geographic names, elevation contours, hydrography, and other selected map features. This map is derived from GIS (geospatial information system) data. It represents a repackaging of GIS data in traditional map form, not creation of new information. The geospatial data in this map are from selected National Map data holdings and other government sources.
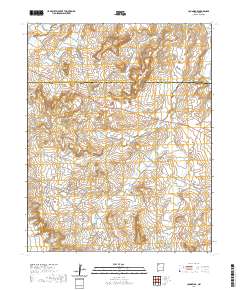
Layered geospatial PDF 7.5 Minute Quadrangle Map. Layers of geospatial data include orthoimagery, roads, grids, geographic names, elevation contours, hydrography, and other selected map features. This map is derived from GIS (geospatial information system) data. It represents a repackaging of GIS data in traditional map form, not creation of new information. The geospatial data in this map are from selected National Map data holdings and other government sources.
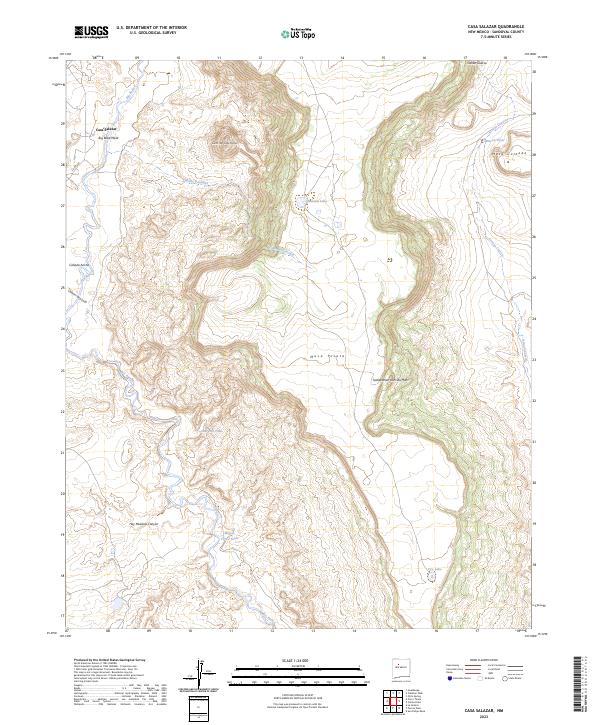
Layered geospatial PDF 7.5 Minute Quadrangle Map. Layers of geospatial data include orthoimagery, roads, grids, geographic names, elevation contours, hydrography, and other selected map features. This map is derived from GIS (geospatial information system) data. It represents a repackaging of GIS data in traditional map form, not creation of new information. The geospatial data in this map are from selected National Map data holdings and other government sources.
|

|
