Filters: Tags: Santa Barbara County (X)
426 results (33ms)|
Filters
Date Range
Extensions (Less) Types (Less)
Contacts (Less)
Categories (Less) Tag Types
|

This part of DS 781 presents data for bathymetry for several seafloor maps of the Offshore of Point Conception Map Area, California. The vector data file is included in "BathymetryHS_OffshorePointConception.zip," which is accessible from https://doi.org/10.5066/F7QN64XQ. Shaded-relief bathymetry of the Offshore of Point Conception map area in southern California was generated largely from acoustic-bathymetry data collected by Fugro Pelagos Inc. Acoustic mapping was completed in 2008 using a combination of 400-kHz Reson 7125, 240-kHz Reson 8101, and 100-kHz Reson 8111 multibeam echosounders. Bathymetric-lidar data was collected in the nearshore area by the U.S. Army Corps of Engineers (USACE) Joint Lidar Bathymetry...
We collected detailed spatial data on the density and size distribution of intertidal snails as part of a broader effort to understand food webs in California estuaries. The survey area was Carpinteria Salt Marsh, California USA, which comprises 9 Ha tidal channels, 2 Ha salt flats, 17 Ha upland habitat, 6 Ha tidal pans, 52 Ha vegetated marsh, 2 Ha tidal flats. Using nearly 4,000 transects in potential snail habitat, we mapped snails throughout the estuary. Specifically, we systematically placed transects at intervals stratified within targeted habitat types: channels, pans, or marsh (or planar habitat that was mixed marsh and pan). At a quarter of the quadrats, we also estimated snail size-frequency distributions....
Categories: Data;
Tags: California,
Carpinteria,
Carpinteria Salt Marsh Reserve,
Santa Barbara County,
USGS Science Data Catalog (SDC),
These data are .csv files of tagged sea otter re-sighting locations (henceforth, resights) collected in the field using a combination of VHF radio telemetry and direct observation using high powered (80x) telescopes. Sea otters were tracked by shore or boat-based observers from the date of tagging until the time of radio battery failure, the animal’s death, or the end of the project, whichever comes first. The frequency of re-sighting was opportunistic, depending on logistical factors such as coastal access, but generally ranged from daily to weekly. Location coordinates are reported latitude and longitude as well as X and Y coordinates in the projection/datum California Teale-Albers NAD 1927. The file contains...
Categories: Data;
Types: Citation;
Tags: California,
Santa Barbara Channel Islands,
Santa Barbara County,
Southern sea otter,
movement patterns,
In 30 surveys, we mapped 21,486 birds comprising 88 species “interact with” the intertidal habitat. Each full “survey” represents a unique month-year-tide combination (but not necessarily a unique day). Specifically, for each of 15 months between January 2012 and March 2013 we conducted separate, but temporally adjacent high-tide and low-tide bird surveys (30 in total) throughout the intertidal habitats. Back to back surveys within the same month are not meant to be independent measures of bird abundance and should be averaged to get an idea of bird abundance in a particular month. Birds were counted if they were in the intertidal habitat. We also counted some species, like raptors, if they were perched in adjacent...
Categories: Data;
Types: Citation,
Downloadable,
Map Service,
OGC WFS Layer,
OGC WMS Layer,
Shapefile;
Tags: California,
Carpinteria,
Carpinteria Salt Marsh Reserve,
Santa Barbara County,
bird,

This part of DS 781 presents data for the Seafloor character map of the Offshore of Point Conception Map Area, California. The vector data file is included in "SeafloorCharacter_OffshorePointConception.zip," which is accessible from https://doi.org/10.5066/F7QN64XQ. This raster-format seafloor-character map shows four substrate classes in the Offshore of Point Conception map area, California. The substrate classes mapped in this area have been colored to indicate which of the following California Marine Life Protection Act depth zones and slope classes they belong: Depth Zone 2 (intertidal to 30 m), Depth Zone 3 (30 to 100 m), Depth Zone 4 (100 to 200 m), Depth Zone 5 (deeper than 200 m), Slope Class 1 (0 degrees...
Layered geospatial PDF 7.5 Minute Quadrangle Map. Layers of geospatial data include orthoimagery, roads, grids, geographic names, elevation contours, hydrography, and other selected map features. This map is derived from GIS (geospatial information system) data. It represents a repackaging of GIS data in traditional map form, not creation of new information. The geospatial data in this map are from selected National Map data holdings and other government sources.
Layered geospatial PDF 7.5 Minute Quadrangle Map. Layers of geospatial data include orthoimagery, roads, grids, geographic names, elevation contours, hydrography, and other selected map features. This map is derived from GIS (geospatial information system) data. It represents a repackaging of GIS data in traditional map form, not creation of new information. The geospatial data in this map are from selected National Map data holdings and other government sources.
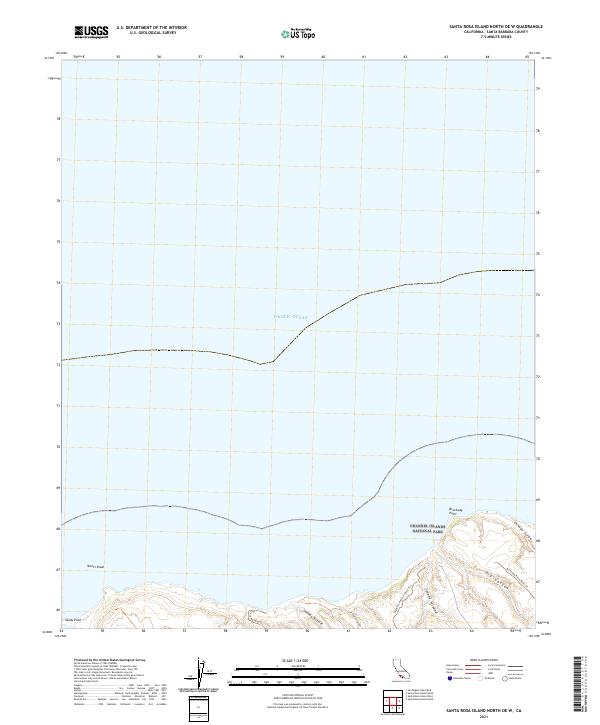
Layered geospatial PDF 7.5 Minute Quadrangle Map. Layers of geospatial data include orthoimagery, roads, grids, geographic names, elevation contours, hydrography, and other selected map features. This map is derived from GIS (geospatial information system) data. It represents a repackaging of GIS data in traditional map form, not creation of new information. The geospatial data in this map are from selected National Map data holdings and other government sources.
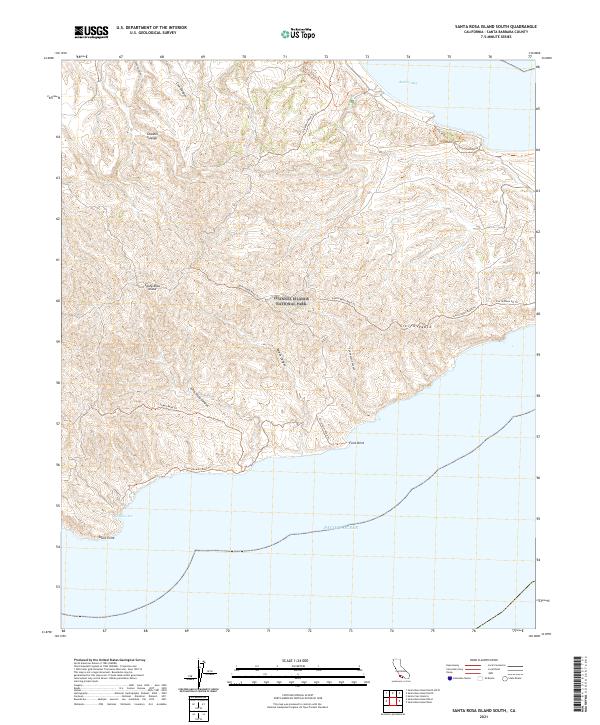
Layered geospatial PDF 7.5 Minute Quadrangle Map. Layers of geospatial data include orthoimagery, roads, grids, geographic names, elevation contours, hydrography, and other selected map features. This map is derived from GIS (geospatial information system) data. It represents a repackaging of GIS data in traditional map form, not creation of new information. The geospatial data in this map are from selected National Map data holdings and other government sources.
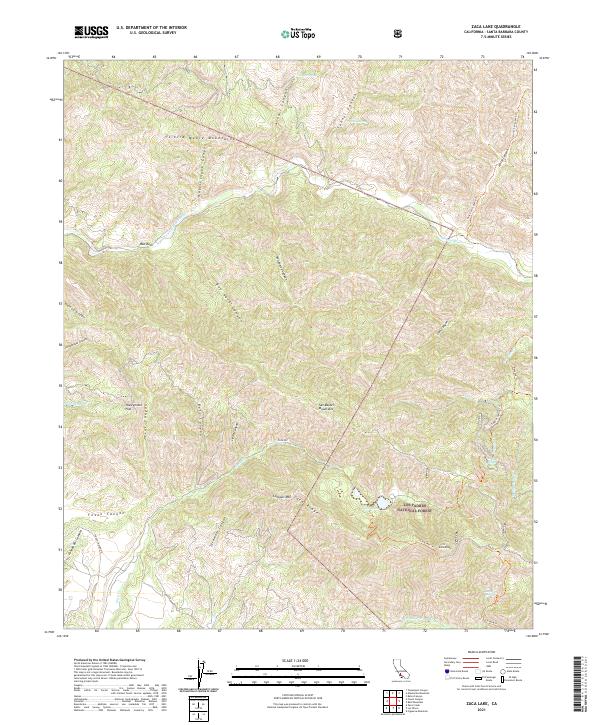
Layered geospatial PDF 7.5 Minute Quadrangle Map. Layers of geospatial data include orthoimagery, roads, grids, geographic names, elevation contours, hydrography, and other selected map features. This map is derived from GIS (geospatial information system) data. It represents a repackaging of GIS data in traditional map form, not creation of new information. The geospatial data in this map are from selected National Map data holdings and other government sources.
Layered geospatial PDF 7.5 Minute Quadrangle Map. Layers of geospatial data include orthoimagery, roads, grids, geographic names, elevation contours, hydrography, and other selected map features. This map is derived from GIS (geospatial information system) data. It represents a repackaging of GIS data in traditional map form, not creation of new information. The geospatial data in this map are from selected National Map data holdings and other government sources.
Layered geospatial PDF 7.5 Minute Quadrangle Map. Layers of geospatial data include orthoimagery, roads, grids, geographic names, elevation contours, hydrography, and other selected map features. This map is derived from GIS (geospatial information system) data. It represents a repackaging of GIS data in traditional map form, not creation of new information. The geospatial data in this map are from selected National Map data holdings and other government sources.
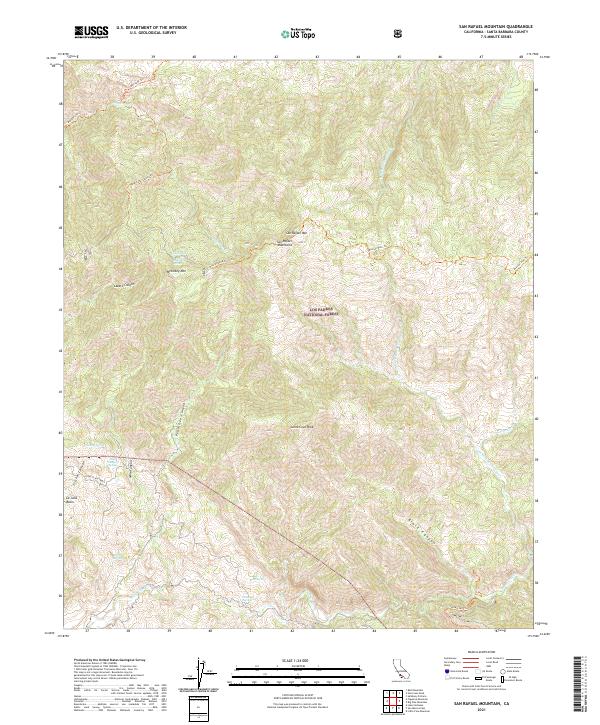
Layered geospatial PDF 7.5 Minute Quadrangle Map. Layers of geospatial data include orthoimagery, roads, grids, geographic names, elevation contours, hydrography, and other selected map features. This map is derived from GIS (geospatial information system) data. It represents a repackaging of GIS data in traditional map form, not creation of new information. The geospatial data in this map are from selected National Map data holdings and other government sources.
Layered geospatial PDF 7.5 Minute Quadrangle Map. Layers of geospatial data include orthoimagery, roads, grids, geographic names, elevation contours, hydrography, and other selected map features. This map is derived from GIS (geospatial information system) data. It represents a repackaging of GIS data in traditional map form, not creation of new information. The geospatial data in this map are from selected National Map data holdings and other government sources.
Layered geospatial PDF 7.5 Minute Quadrangle Map. Layers of geospatial data include orthoimagery, roads, grids, geographic names, elevation contours, hydrography, and other selected map features. This map is derived from GIS (geospatial information system) data. It represents a repackaging of GIS data in traditional map form, not creation of new information. The geospatial data in this map are from selected National Map data holdings and other government sources.
Layered geospatial PDF 7.5 Minute Quadrangle Map. Layers of geospatial data include orthoimagery, roads, grids, geographic names, elevation contours, hydrography, and other selected map features. This map is derived from GIS (geospatial information system) data. It represents a repackaging of GIS data in traditional map form, not creation of new information. The geospatial data in this map are from selected National Map data holdings and other government sources.
Layered geospatial PDF 7.5 Minute Quadrangle Map. Layers of geospatial data include orthoimagery, roads, grids, geographic names, elevation contours, hydrography, and other selected map features. This map is derived from GIS (geospatial information system) data. It represents a repackaging of GIS data in traditional map form, not creation of new information. The geospatial data in this map are from selected National Map data holdings and other government sources.

These data were released prior to the October 1, 2016 effective date for the USGS’s policy dictating the review, approval, and release of scientific data as referenced in USGS Survey Manual Chapter 502.8 Fundamental Science Practices: Review and Approval of Scientific Data for Release. This digital dataset defines the spring 1961 water-table altitude for the California's Central Valley. It was used to initiate the water-level altitudes for the upper zones of the transient hydrologic model of the Central Valley flow system. The Central Valley encompasses an approximate 50,000 square-kilometer region of California. The complex hydrologic system of the Central Valley is simulated using the USGS numerical modeling...

These data were released prior to the October 1, 2016 effective date for the USGS’s policy dictating the review, approval, and release of scientific data as referenced in USGS Survey Manual Chapter 502.8 Fundamental Science Practices: Review and Approval of Scientific Data for Release. This digital dataset defines the model grid and altitudes of the top of the 10 model layers and base of the model simulated in the transient hydrologic model of the Central Valley flow system. The Central Valley encompasses an approximate 50,000 square-kilometer region of California. The complex hydrologic system of the Central Valley is simulated using the USGS numerical modeling code MODFLOW-FMP (Schmid and others, 2006), which...

These data were released prior to the October 1, 2016 effective date for the USGS’s policy dictating the review, approval, and release of scientific data as referenced in USGS Survey Manual Chapter 502.8 Fundamental Science Practices: Review and Approval of Scientific Data for Release. This digital dataset contains the surface-water network for the Central Valley Hydrologic Model (CVHM). The Central Valley encompasses an approximate 50,000-square-kilometer region of California. The complex hydrologic system of the Central Valley is simulated using the USGS numerical modeling code MODFLOW-FMP (Schmid and others, 2006). This simulation is referred to here as the CVHM (Faunt, 2009). Utilizing MODFLOW-FMP, the CVHM...
|

|
