Filters: Tags: Santa Barbara County (X)
426 results (23ms)|
Filters
Date Range
Extensions Types Contacts
Categories Tag Types
|
Layers of geospatial data include contours, boundaries, land cover, hydrography, roads, transportation, geographic names, structures, and other selected map features.
Layers of geospatial data include contours, boundaries, land cover, hydrography, roads, transportation, geographic names, structures, and other selected map features.
Layers of geospatial data include contours, boundaries, land cover, hydrography, roads, transportation, geographic names, structures, and other selected map features.
Layers of geospatial data include contours, boundaries, land cover, hydrography, roads, transportation, geographic names, structures, and other selected map features.
Layers of geospatial data include contours, boundaries, land cover, hydrography, roads, transportation, geographic names, structures, and other selected map features.
Layers of geospatial data include contours, boundaries, land cover, hydrography, roads, transportation, geographic names, structures, and other selected map features.
Layers of geospatial data include contours, boundaries, land cover, hydrography, roads, transportation, geographic names, structures, and other selected map features.
Layers of geospatial data include contours, boundaries, land cover, hydrography, roads, transportation, geographic names, structures, and other selected map features.
Layers of geospatial data include contours, boundaries, land cover, hydrography, roads, transportation, geographic names, structures, and other selected map features.
Layers of geospatial data include contours, boundaries, land cover, hydrography, roads, transportation, geographic names, structures, and other selected map features.
Layers of geospatial data include contours, boundaries, land cover, hydrography, roads, transportation, geographic names, structures, and other selected map features.
Layers of geospatial data include contours, boundaries, land cover, hydrography, roads, transportation, geographic names, structures, and other selected map features.

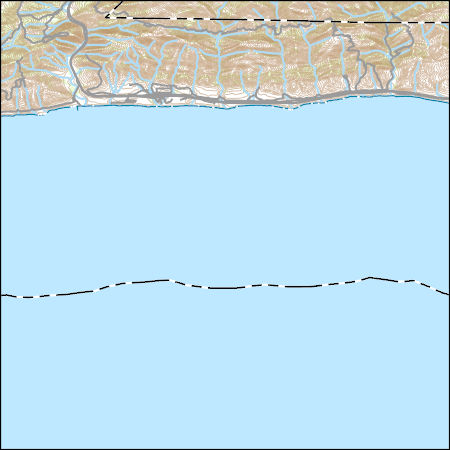
This part of DS 781 presents 2-m-resolution data collected by the U.S. Geological Survey in 2007 for the acoustic-backscatter map of the Offshore of Gaviota Map Area, California. The GeoTiff is included in "Backscatter_[USGS07]_OffshoreGaviota.zip," which is accessible from https://doi.org/10.5066/F7TH8JWJ. The acoustic-backscatter map of the Offshore of Gaviota map area in southern California was generated from acoustic-backscatter data collected by the U.S. Geological Survey (USGS) and by Fugro Pelagos Inc. Acoustic mapping was completed between 2007 and 2008 using a combination of 400-kHz Reson 7125, 240-kHz Reson 8101, and 100-kHz Reson 8111 multibeam echosounders, as well as a 234-kHz SEA SWATHplus bathymetric...
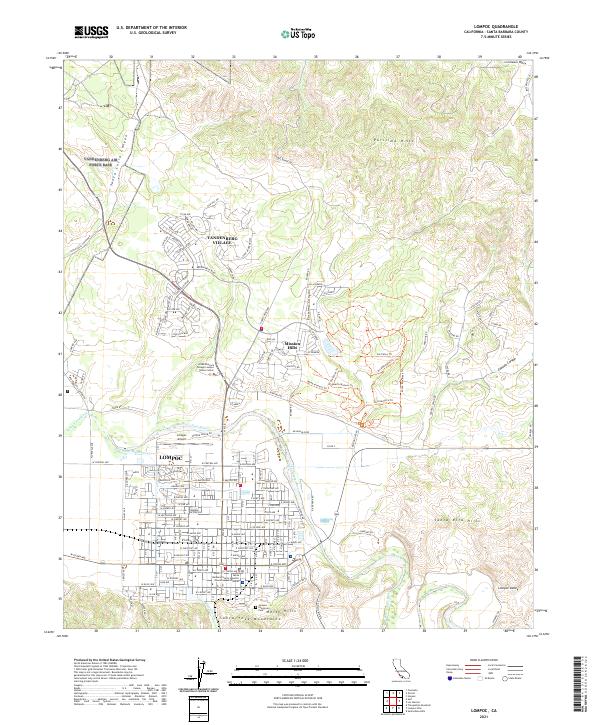
USGS Topo Map Vector Data (Vector) 70159 Gaviota, California 20220513 for 7.5 x 7.5 minute Shapefile
Layers of geospatial data include contours, boundaries, land cover, hydrography, roads, transportation, geographic names, structures, and other selected map features.
The U.S. Geological Survey (USGS) in cooperation with the California State Water Resources Control Board collected produced water samples for analysis of volatile organic compounds (VOCs) in the eight California oil fields of Fruitvale, Lost Hills, North Belridge, Orcutt, Placerita, South Belridge, Midway-Sunset, and Buena Vista from 2016 to 2020. Sampled sites included oil wells; injectate from tanks, pipelines, and injection wells where produced water from many wells, after removal of oil, is stored or transported prior to underground injection; integrated produced water from many oil wells collected from pipelines before oil removal; and surface disposal ponds where produced water, after removal of oil, is disposed...
The current study was designed to provide critical information for resource managers (specifically the Bureau of Ocean Energy Management, henceforth BOEM, and the U.S. Fish and Wildlife Service, henceforth USFWS) about the spatial ecology, population status, and potential population threats to sea otters in Santa Barbara Channel, with particular reference to exposure to manmade structures and sources of oil and natural gas. Our four primary research objectives were: 1. Determine the extent of movements and spatial use patterns by sea otters along the southern California coast 2. Identify important sea otter resting and foraging areas adjacent to manmade structures 3. Assess sea otter distribution, behavior and...

This part of DS 781 presents data for the geologic and geomorphic map of the Offshore of Point Conception Map Area, California. The vector data file is included in "Geology_OffshorePointConception.zip," which is accessible from https://doi.org/10.5066/F7QN64XQ. Marine geology and geomorphology were mapped in the Offshore of Point Conception map area from the shoreline to the 3-nautical-mile limit of California's State Waters. The location of the shoreline, whi ch is from the National Oceanic and Atmospheric Administration's (NOAA's) Shoreline Data Explorer, is based on their analysis of lidar data (National Geodetic Survey, 2016). Offshore geologic units were delineated on the basis of integrated analyses of adjacent...
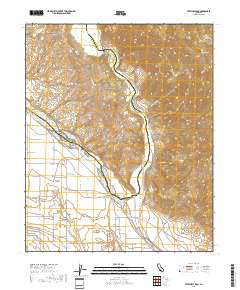
Layered geospatial PDF 7.5 Minute Quadrangle Map. Layers of geospatial data include orthoimagery, roads, grids, geographic names, elevation contours, hydrography, and other selected map features. This map is derived from GIS (geospatial information system) data. It represents a repackaging of GIS data in traditional map form, not creation of new information. The geospatial data in this map are from selected National Map data holdings and other government sources.
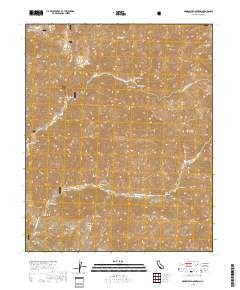
Layered geospatial PDF 7.5 Minute Quadrangle Map. Layers of geospatial data include orthoimagery, roads, grids, geographic names, elevation contours, hydrography, and other selected map features. This map is derived from GIS (geospatial information system) data. It represents a repackaging of GIS data in traditional map form, not creation of new information. The geospatial data in this map are from selected National Map data holdings and other government sources.
Layered geospatial PDF 7.5 Minute Quadrangle Map. Layers of geospatial data include orthoimagery, roads, grids, geographic names, elevation contours, hydrography, and other selected map features. This map is derived from GIS (geospatial information system) data. It represents a repackaging of GIS data in traditional map form, not creation of new information. The geospatial data in this map are from selected National Map data holdings and other government sources.
|

|
