Filters: Tags: Santa Cruz County (X) > partyWithName: U.S. Geological Survey (X)
211 results (13ms)|
Filters
Date Range
Extensions Types Contacts
Categories Tag Types
|
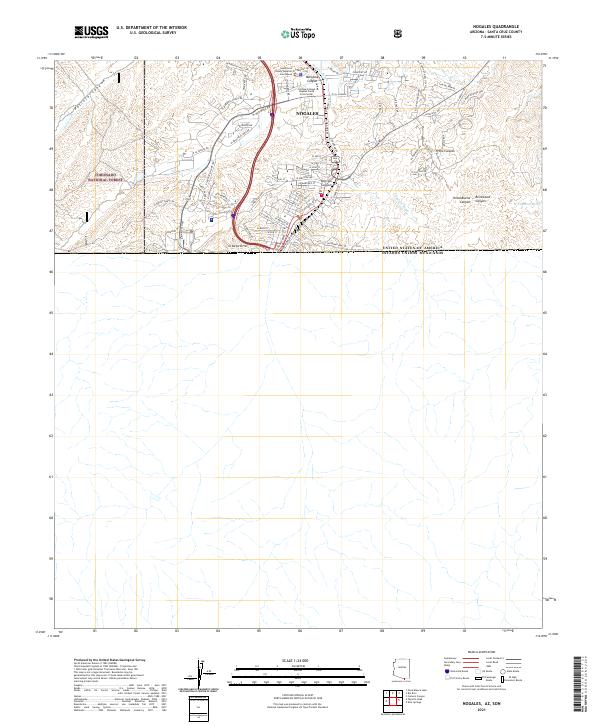
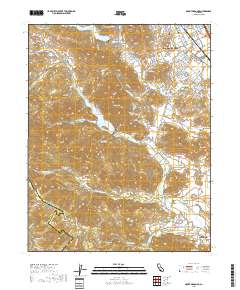
Layered geospatial PDF 7.5 Minute Quadrangle Map. Layers of geospatial data include orthoimagery, roads, grids, geographic names, elevation contours, hydrography, and other selected map features. This map is derived from GIS (geospatial information system) data. It represents a repackaging of GIS data in traditional map form, not creation of new information. The geospatial data in this map are from selected National Map data holdings and other government sources.
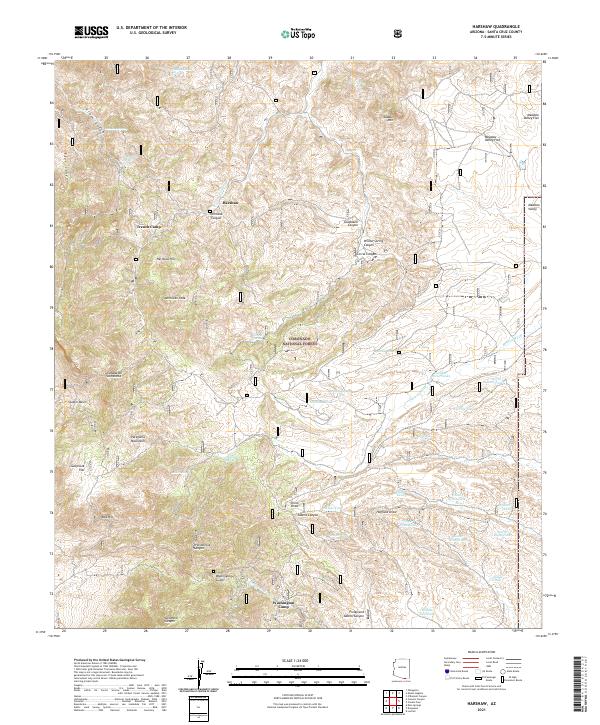
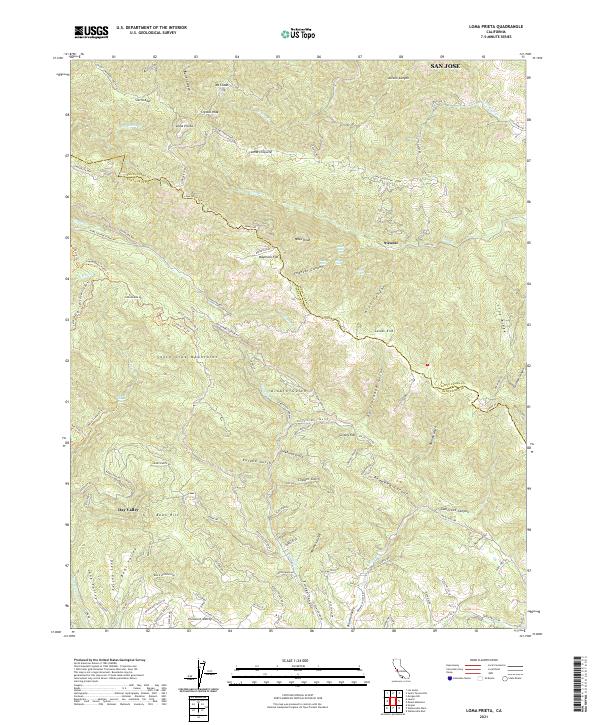
Layered geospatial PDF 7.5 Minute Quadrangle Map. Layers of geospatial data include orthoimagery, roads, grids, geographic names, elevation contours, hydrography, and other selected map features. This map is derived from GIS (geospatial information system) data. It represents a repackaging of GIS data in traditional map form, not creation of new information. The geospatial data in this map are from selected National Map data holdings and other government sources.
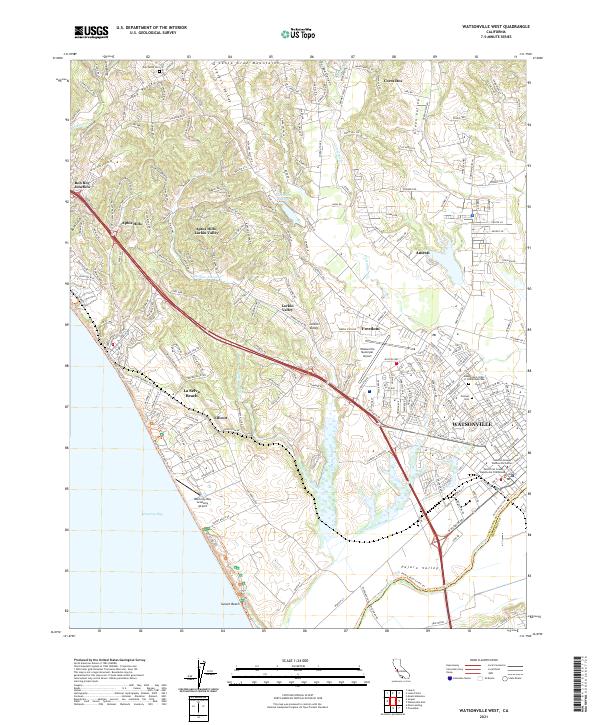
Layered geospatial PDF 7.5 Minute Quadrangle Map. Layers of geospatial data include orthoimagery, roads, grids, geographic names, elevation contours, hydrography, and other selected map features. This map is derived from GIS (geospatial information system) data. It represents a repackaging of GIS data in traditional map form, not creation of new information. The geospatial data in this map are from selected National Map data holdings and other government sources.
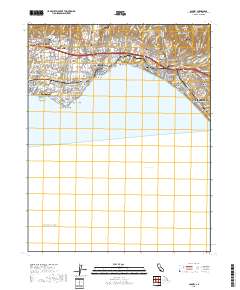
Layered geospatial PDF 7.5 Minute Quadrangle Map. Layers of geospatial data include orthoimagery, roads, grids, geographic names, elevation contours, hydrography, and other selected map features. This map is derived from GIS (geospatial information system) data. It represents a repackaging of GIS data in traditional map form, not creation of new information. The geospatial data in this map are from selected National Map data holdings and other government sources.
Layered geospatial PDF 7.5 Minute Quadrangle Map. Layers of geospatial data include orthoimagery, roads, grids, geographic names, elevation contours, hydrography, and other selected map features. This map is derived from GIS (geospatial information system) data. It represents a repackaging of GIS data in traditional map form, not creation of new information. The geospatial data in this map are from selected National Map data holdings and other government sources.
Layered geospatial PDF 7.5 Minute Quadrangle Map. Layers of geospatial data include orthoimagery, roads, grids, geographic names, elevation contours, hydrography, and other selected map features. This map is derived from GIS (geospatial information system) data. It represents a repackaging of GIS data in traditional map form, not creation of new information. The geospatial data in this map are from selected National Map data holdings and other government sources.
Layered geospatial PDF 7.5 Minute Quadrangle Map. Layers of geospatial data include orthoimagery, roads, grids, geographic names, elevation contours, hydrography, and other selected map features. This map is derived from GIS (geospatial information system) data. It represents a repackaging of GIS data in traditional map form, not creation of new information. The geospatial data in this map are from selected National Map data holdings and other government sources.
This part of DS 781 presents data for the sediment-thickness map of the Pigeon Point to Monterey, California, map region. The raster data file is included in "SedimentThickness_PigeonPointToMontereyBay.zip," which is accessible from https://doi.org/10.5066/F7N29V0Z. As part of the USGS's California State Waters Mapping Project, a 50-m-resolution grid of sediment thickness for the seafloor within the limit of California’s State Waters between Pigeon Point and southern Monterey Bay was generated from seismic-reflection data collected in 2009, 2010, and 2011 (USGS activities (S-15-10-NC, S-N1-09-MB, and S-06-11-MB) supplemented with outcrop and geologic structure from DS 781. Isopach contours at 2.5-meter intervals...
Categories: Data;
Types: Downloadable,
GeoTIFF,
Map Service,
Raster;
Tags: Ano Nuevo,
Aptos,
Distributions,
Marina,
Monterey,
These vector contour lines are derived from the 3D Elevation Program using automated and semi-automated processes. They were created to support 1:24,000-scale CONUS and Hawaii, 1:25,000-scale Alaska, and 1:20,000-scale Puerto Rico / US Virgin Island topographic map products, but are also published in this GIS vector format. Contour intervals are assigned by 7.5-minute quadrangle, so this vector dataset is not visually seamless across quadrangle boundaries. The vector lines have elevation attributes (in feet above mean sea level on NAVD88), but this dataset does not carry line symbols or annotation.
Layered geospatial PDF 7.5 Minute Quadrangle Map. Layers of geospatial data include orthoimagery, roads, grids, geographic names, elevation contours, hydrography, and other selected map features. This map is derived from GIS (geospatial information system) data. It represents a repackaging of GIS data in traditional map form, not creation of new information. The geospatial data in this map are from selected National Map data holdings and other government sources.
Layered geospatial PDF 7.5 Minute Quadrangle Map. Layers of geospatial data include orthoimagery, roads, grids, geographic names, elevation contours, hydrography, and other selected map features. This map is derived from GIS (geospatial information system) data. It represents a repackaging of GIS data in traditional map form, not creation of new information. The geospatial data in this map are from selected National Map data holdings and other government sources.
Layered geospatial PDF 7.5 Minute Quadrangle Map. Layers of geospatial data include orthoimagery, roads, grids, geographic names, elevation contours, hydrography, and other selected map features. This map is derived from GIS (geospatial information system) data. It represents a repackaging of GIS data in traditional map form, not creation of new information. The geospatial data in this map are from selected National Map data holdings and other government sources.
Layered geospatial PDF 7.5 Minute Quadrangle Map. Layers of geospatial data include orthoimagery, roads, grids, geographic names, elevation contours, hydrography, and other selected map features. This map is derived from GIS (geospatial information system) data. It represents a repackaging of GIS data in traditional map form, not creation of new information. The geospatial data in this map are from selected National Map data holdings and other government sources.

This part of DS 781 presents data for the bathymetry map of Offshore Scott Creek, California. The raster data file is included in "Bathymetry_OffshoreScottCreek.zip", which is accessible from https://doi.org/10.5066/F7CJ8BJW. These data accompany the pamphlet and map sheets of Cochrane, G.R., Dartnell, P., Johnson, S.Y., Greene, H.G., Erdey, M.D., Dieter, B.E., Golden, N.E., Endris, C.A., Hartwell, S.R., Kvitek, R.G., Davenport, C.W., Watt, J.T., Krigsman, L.M., Ritchie, A.C., Sliter, R.W., Finlayson, D.P., and Maier, K.L. (G.R. Cochrane and S.A. Cochran, eds.), 2015, California State Waters Map Series--Offshore of Scott Creek, California: U.S. Geological Survey Open-File Report 2015-1191, pamphlet 40 p., 10 sheets,...
Categories: Data;
Types: Downloadable,
GeoTIFF,
Map Service,
Raster;
Tags: Acoustic Reflectivity,
CMHRP,
Coastal and Marine Hazards and Resources Program,
Continental/Island Shelf,
Marine Nearshore Subtidal,

This part of DS 781 presents data for the faults for the geologic and geomorphic map of the Offshore of Scott Creek map area, California. The vector data file is included in "Faults_OffshoreScottCreek.zip," which is accessible from https://doi.org/10.5066/F7CJ8BJW. These data accompany the pamphlet and map sheets of Cochrane, G.R., Dartnell, P., Johnson, S.Y., Greene, H.G., Erdey, M.D., Dieter, B.E., Golden, N.E., Endris, C.A., Hartwell, S.R., Kvitek, R.G., Davenport, C.W., Watt, J.T., Krigsman, L.M., Ritchie, A.C., Sliter, R.W., Finlayson, D.P., and Maier, K.L. (G.R. Cochrane and S.A. Cochran, eds.), 2015, California State Waters Map Series--Offshore of Scott Creek, California: U.S. Geological Survey Open-File...
Categories: Data;
Types: Downloadable,
Map Service,
OGC WFS Layer,
OGC WMS Layer,
Shapefile;
Tags: Bathymetry,
CMHRP,
Coastal and Marine Hazards and Resources Program,
Continental/Island Shelf,
Marine Nearshore Subtidal,
This portion of the USGS data release presents topography data collected during surveys performed along northern Monterey Bay, California, in March 2017 (USGS Field Activity Number 2017-620-FA). Topographic profiles were collected on foot with GNSS receivers mounted on backpacks. Prior to data collection, vertical distances between the GNSS antennas and the ground were measured using a tape measure. Hand-held data collectors were used to log raw data and display navigational information allowing surveyors to navigate survey lines spaced at 50- to 250-m intervals along the beach. Profiles were surveyed from the landward edge of the study area (either the base of a bluff, engineering structure, or just landward of...
Categories: Data;
Types: Map Service,
OGC WFS Layer,
OGC WMS Layer,
OGC WMS Service;
Tags: Bathymetry and Elevation,
CMGP,
Coastal and Marine Geology Program,
GPS (Global Positioning System),
GPS measurement,
This portion of the USGS data release presents bathymetry data collected during surveys performed in northern Monterey Bay, California in September 2016 (USGS Field Activity Number 2016-674-FA). Bathymetry data were collected using a personal watercraft (PWC) and small boat equipped with single-beam sonar systems and global navigation satellite system (GNSS) receivers. The sonar systems consisted of an Odom Echotrac CV-100 single-beam echosounder and 200 kHz transducer with a 9° beam angle. Raw acoustic backscatter returns were digitized by the echosounder with a vertical resolution of 1.25 cm. Depths from the echosounders were computed using sound velocity profiles measured using a YSI CastAway CTD during the survey....
Categories: Data;
Types: Map Service,
OGC WFS Layer,
OGC WMS Layer,
OGC WMS Service;
Tags: Bathymetry and Elevation,
CMGP,
Coastal and Marine Geology Program,
Echo Sounders,
GPS (Global Positioning System),
This portion of the USGS data release presents bathymetry data collected during surveys performed in northern Monterey Bay, California in March 2016 (USGS Field Activity Number 2016-627-FA). Bathymetry data were collected using two personal watercraft (PWCs) equipped with single-beam sonar systems and global navigation satellite system (GNSS) receivers. The sonar systems consisted of an Odom Echotrac CV-100 single-beam echosounder and 200 kHz transducer with a 9° beam angle. Raw acoustic backscatter returns were digitized by the echosounder with a vertical resolution of 1.25 cm. Depths from the echosounders were computed using sound velocity profiles measured using a YSI CastAway CTD during the survey. Positioning...
Categories: Data;
Types: Citation,
Map Service,
OGC WFS Layer,
OGC WMS Layer,
OGC WMS Service;
Tags: Bathymetry and Elevation,
CMGP,
Coastal and Marine Geology Program,
Echo Sounders,
GPS (Global Positioning System),
This part of the data release presents topography data from northern Monterey Bay, California collected in March 2016 using a tripod-mounted Riegl VZ-1000 lidar scanner (USGS Field Activity 2016-627-FA). For each area surveyed, the scanner was placed at several positions which were selected to provide maximum line-of-sight coverage of the area of interest. Scans were typically conducted in panoramic mode, creating a detailed point cloud of all unobstructed surfaces in a 360 degree view of the scanner. At each scan position, co-registered photographic imagery was also collected with a scanner mounted DSLR camera. Scanner registration was performed by placing four or more cylindrical or flat reflective tripod-mounted...
Categories: Data;
Types: Map Service,
OGC WFS Layer,
OGC WMS Layer,
OGC WMS Service;
Tags: Bathymetry and Elevation,
CMGP,
Coastal and Marine Geology Program,
GPS (Global Positioning System),
LIDAR,
This portion of the USGS data release presents topography data collected during surveys performed along northern Monterey Bay, California, in March 2015 (USGS Field Activity Number 2015-625-FA). Topographic profiles were collected on foot with GNSS receivers mounted on backpacks. Prior to data collection, vertical distances between the GNSS antennas and the ground were measured using a tape measure. Hand-held data collectors were used to log raw data and display navigational information allowing surveyors to navigate survey lines spaced at 50- to 250-m intervals along the beach. Profiles were surveyed from the landward edge of the study area (either the base of a bluff, engineering structure, or just landward of...
Categories: Data;
Types: Citation,
Map Service,
OGC WFS Layer,
OGC WMS Layer,
OGC WMS Service;
Tags: Bathymetry and Elevation,
CMGP,
Coastal and Marine Geology Program,
GPS (Global Positioning System),
GPS measurement,
|

|
