Filters: Tags: Sarpy County (X)
60 results (66ms)|
Filters
Date Range
Types Contacts
Categories Tag Types Tag Schemes |

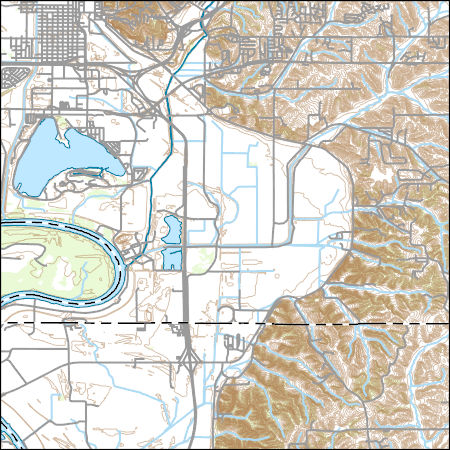
Layers of geospatial data include contours, boundaries, land cover, hydrography, roads, transportation, geographic names, structures, and other selected map features.
Types: Citation;
Tags: 7.5 x 7.5 minute,
7.5 x 7.5 minute,
Combined Vector,
Combined Vector,
Combined Vector,

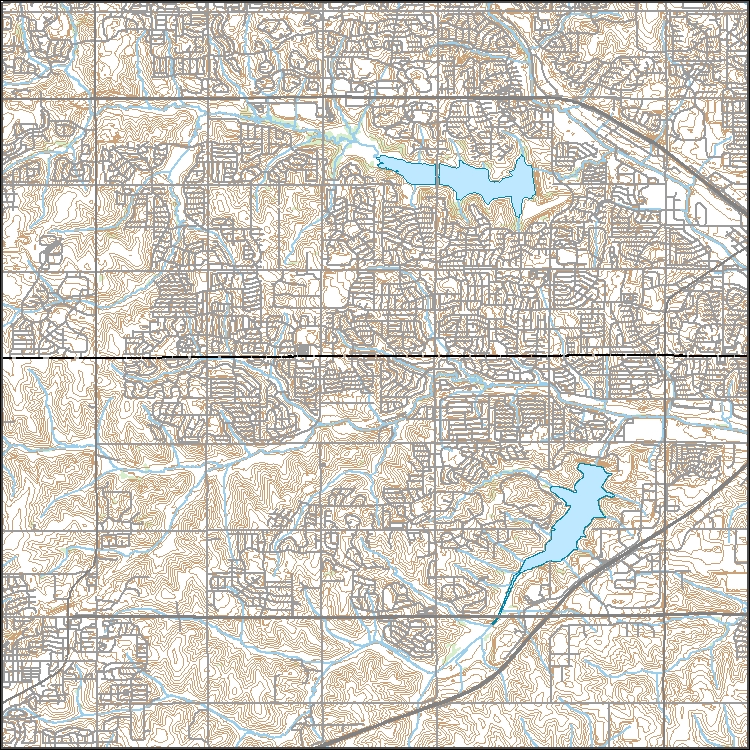
USGS Topo Map Vector Data (Vector) 27491 Manley, Nebraska 20210714 for 7.5 x 7.5 minute FileGDB 10.1
Layers of geospatial data include contours, boundaries, land cover, hydrography, roads, transportation, geographic names, structures, and other selected map features.
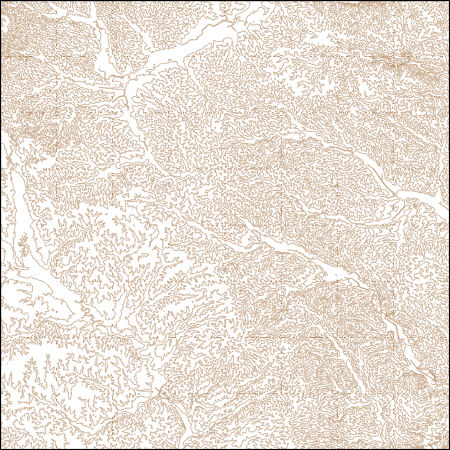
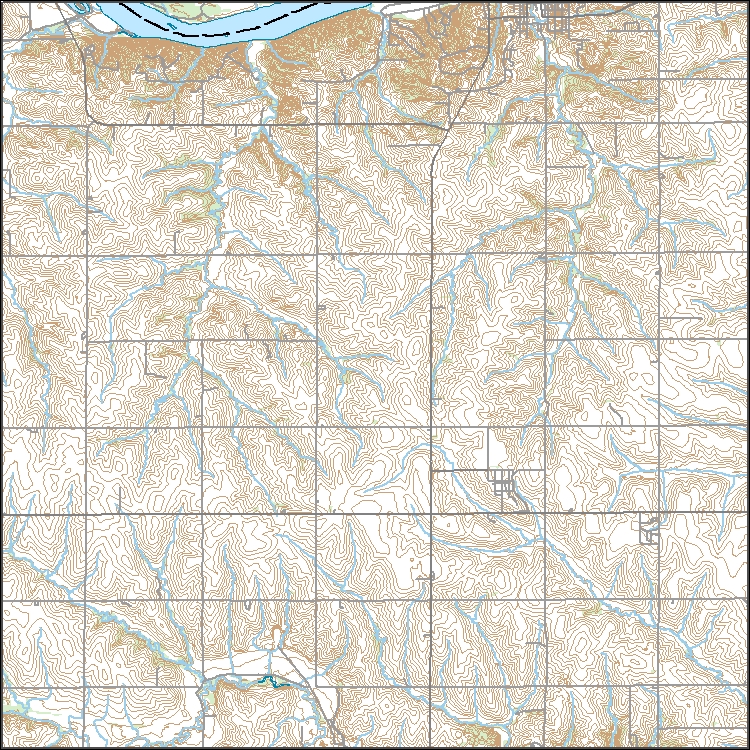
These vector contour lines are derived from the 3D Elevation Program using automated and semi-automated processes. They were created to support 1:24,000-scale CONUS and Hawaii, 1:25,000-scale Alaska, and 1:20,000-scale Puerto Rico / US Virgin Island topographic map products, but are also published in this GIS vector format. Contour intervals are assigned by 7.5-minute quadrangle, so this vector dataset is not visually seamless across quadrangle boundaries. The vector lines have elevation attributes (in feet above mean sea level on NAVD88), but this dataset does not carry line symbols or annotation.
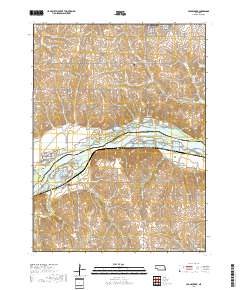
Layered geospatial PDF 7.5 Minute Quadrangle Map. Layers of geospatial data include orthoimagery, roads, grids, geographic names, elevation contours, hydrography, and other selected map features. This map is derived from GIS (geospatial information system) data. It represents a repackaging of GIS data in traditional map form, not creation of new information. The geospatial data in this map are from selected National Map data holdings and other government sources.
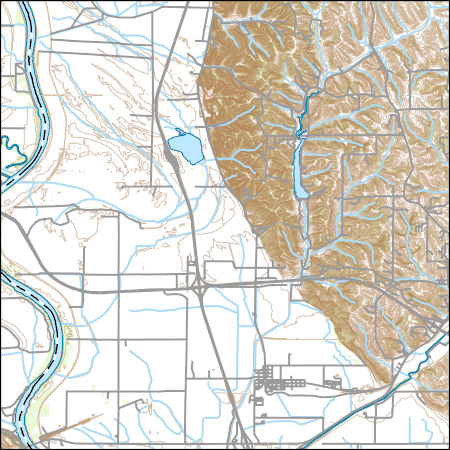
This dataset is a file of contour lines representing the estimated altitude of the water table in western Sarpy County. This dataset was developed as part of a cooperative study between the Papillion-Missouri River Natural Resources District (PMRNRD) and USGS which began in 2017. The goal of this study was to develop a hydrogeologic visualization model of western Sarpy County using GeoScene3D. In 2016, the PMRNRD contracted airborne electromagnetic surveys (AEM) of the area to be completed to better understand the stratigraphy and hydrogeology of the western Sarpy County area. The PMRNRD determined that they wanted to incorporate the AEM data into a visualization tool that would allow PMRNRD staff to easily interact...
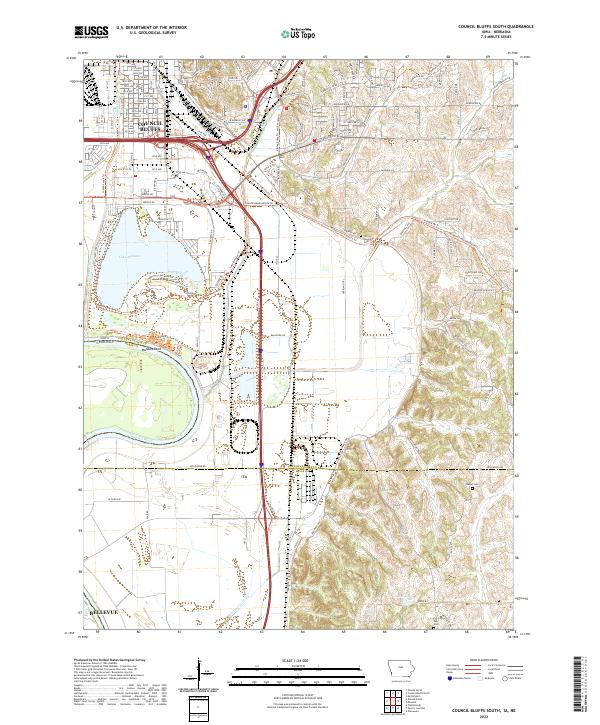
Layered geospatial PDF 7.5 Minute Quadrangle Map. Layers of geospatial data include orthoimagery, roads, grids, geographic names, elevation contours, hydrography, and other selected map features. This map is derived from GIS (geospatial information system) data. It represents a repackaging of GIS data in traditional map form, not creation of new information. The geospatial data in this map are from selected National Map data holdings and other government sources.
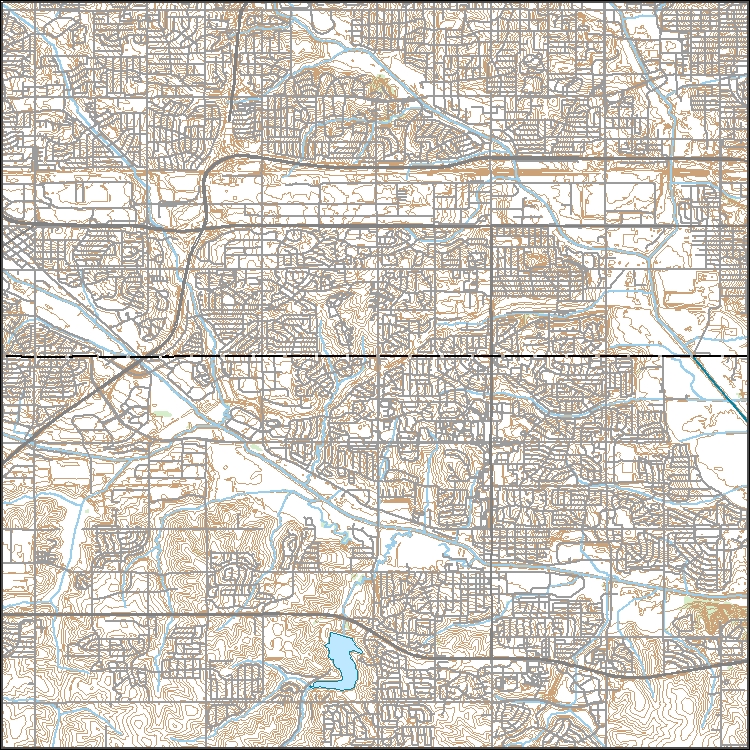
Layers of geospatial data include contours, boundaries, land cover, hydrography, roads, transportation, geographic names, structures, and other selected map features.
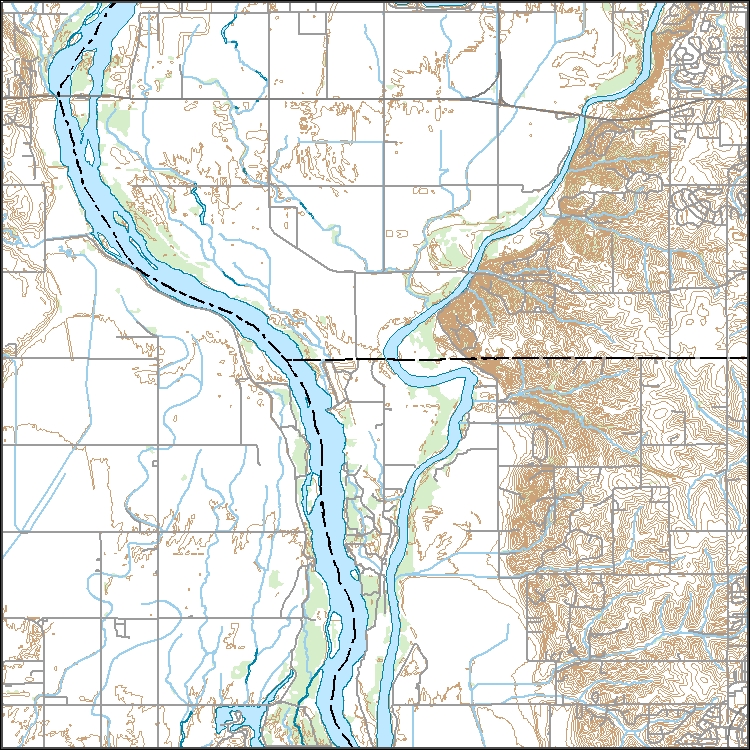
USGS Topo Map Vector Data (Vector) 18528 Gretna, Nebraska 20210714 for 7.5 x 7.5 minute FileGDB 10.1
Layers of geospatial data include contours, boundaries, land cover, hydrography, roads, transportation, geographic names, structures, and other selected map features.
Layers of geospatial data include contours, boundaries, land cover, hydrography, roads, transportation, geographic names, structures, and other selected map features.
Layers of geospatial data include contours, boundaries, land cover, hydrography, roads, transportation, geographic names, structures, and other selected map features.
Types: Citation;
Tags: 7.5 x 7.5 minute,
7.5 x 7.5 minute,
Cass County,
Combined Vector,
Combined Vector,
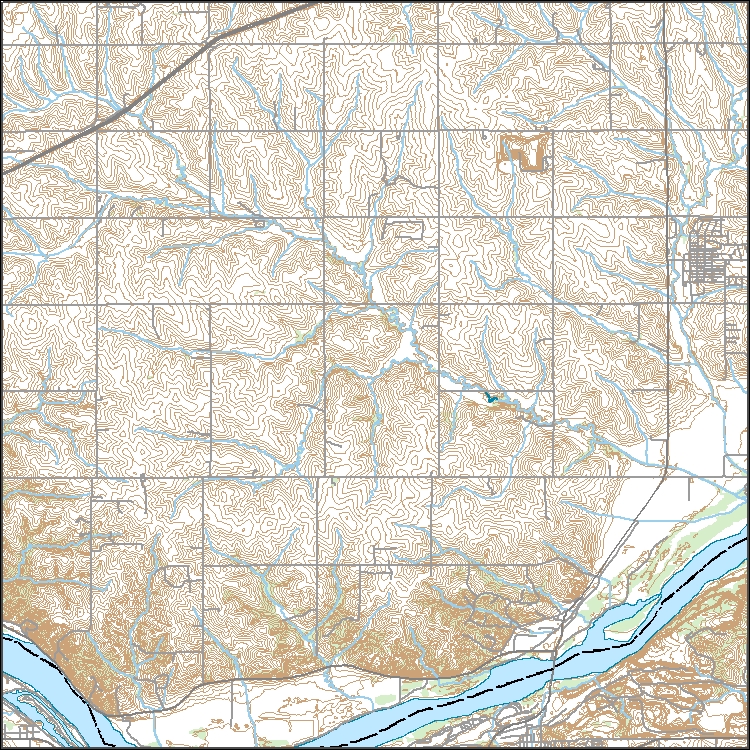
This dataset includes a grid raster and contour line file representing the estimated altitude of the top of the Pennsylvanian-age units in western Sarpy County, Nebraska. This dataset was developed as part of a cooperative study between the PMRNRD and USGS which began in 2017. The goal of this study was to develop a hydrogeologic visualization model of western Sarpy County using GeoScene3D. In 2016, the Papillion-Missouri River Natural Resources District (PMRNRD) contracted airborne electromagnetic surveys (AEM) of the area to be completed to better understand the stratigraphy and hydrogeology of the western Sarpy County area. The PMRNRD determined that they wanted to incorporate the AEM data into a visualization...
Layers of geospatial data include contours, boundaries, land cover, hydrography, roads, transportation, geographic names, structures, and other selected map features.
Layers of geospatial data include contours, boundaries, land cover, hydrography, roads, transportation, geographic names, structures, and other selected map features.
Types: Citation;
Tags: 7.5 x 7.5 minute,
7.5 x 7.5 minute,
Combined Vector,
Combined Vector,
Combined Vector,
Layers of geospatial data include contours, boundaries, land cover, hydrography, roads, transportation, geographic names, structures, and other selected map features.

Layers of geospatial data include contours, boundaries, land cover, hydrography, roads, transportation, geographic names, structures, and other selected map features.
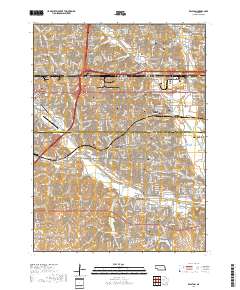
Layered geospatial PDF 7.5 Minute Quadrangle Map. Layers of geospatial data include orthoimagery, roads, grids, geographic names, elevation contours, hydrography, and other selected map features. This map is derived from GIS (geospatial information system) data. It represents a repackaging of GIS data in traditional map form, not creation of new information. The geospatial data in this map are from selected National Map data holdings and other government sources.

These vector contour lines are derived from the 3D Elevation Program using automated and semi-automated processes. They were created to support 1:24,000-scale CONUS and Hawaii, 1:25,000-scale Alaska, and 1:20,000-scale Puerto Rico / US Virgin Island topographic map products, but are also published in this GIS vector format. Contour intervals are assigned by 7.5-minute quadrangle, so this vector dataset is not visually seamless across quadrangle boundaries. The vector lines have elevation attributes (in feet above mean sea level on NAVD88), but this dataset does not carry line symbols or annotation.
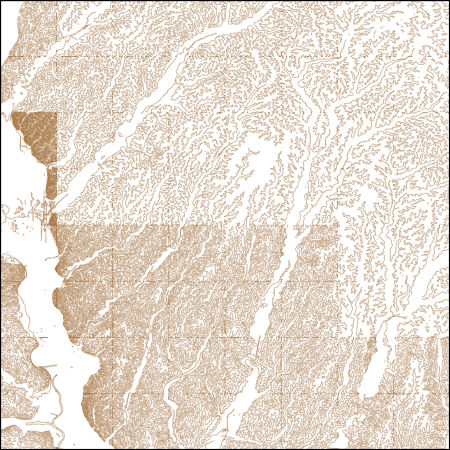
These vector contour lines are derived from the 3D Elevation Program using automated and semi-automated processes. They were created to support 1:24,000-scale CONUS and Hawaii, 1:25,000-scale Alaska, and 1:20,000-scale Puerto Rico / US Virgin Island topographic map products, but are also published in this GIS vector format. Contour intervals are assigned by 7.5-minute quadrangle, so this vector dataset is not visually seamless across quadrangle boundaries. The vector lines have elevation attributes (in feet above mean sea level on NAVD88), but this dataset does not carry line symbols or annotation.
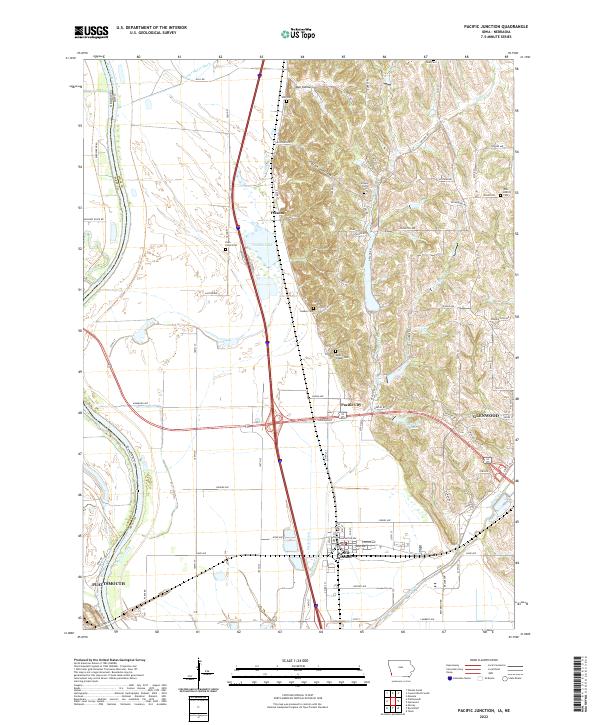
Layered geospatial PDF 7.5 Minute Quadrangle Map. Layers of geospatial data include orthoimagery, roads, grids, geographic names, elevation contours, hydrography, and other selected map features. This map is derived from GIS (geospatial information system) data. It represents a repackaging of GIS data in traditional map form, not creation of new information. The geospatial data in this map are from selected National Map data holdings and other government sources.
This data release contains the inputs and outputs from the development of Escherichia coli (E. coli) concentration models for the four Missouri River sites near Omaha, Nebraska. Model development, models, and results are published in the associated U.S. Geological Survey (USGS) report Densmore and others, 2020. Load Estimator models (LOADEST) (Runkel and others, 2004) were developed from the first 5 years of data (July 2012–September 2016). Sites include Missouri River at NP Dodge Park at Omaha, Nebr. (USGS Site ID 412126095565201), Missouri River at Freedom Park Omaha, Nebr. (USGS Site ID 411636095535104), Missouri River near Council Bluffs, Iowa (USGS Site ID 06610505), and Missouri River near La Platte, Nebr....
|

|
