Filters: Tags: Sonoma County (X)
287 results (46ms)|
Filters
Date Range
Extensions Types Contacts
Categories Tag Types
|
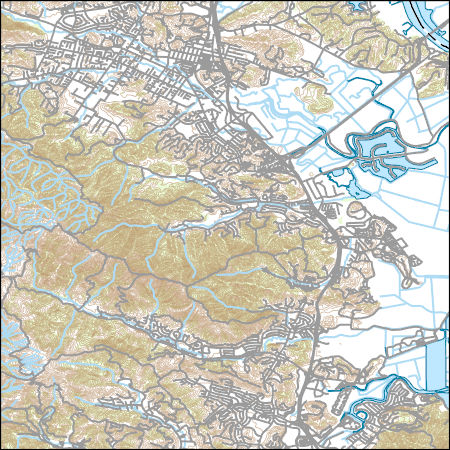
Layers of geospatial data include contours, boundaries, land cover, hydrography, roads, transportation, geographic names, structures, and other selected map features.
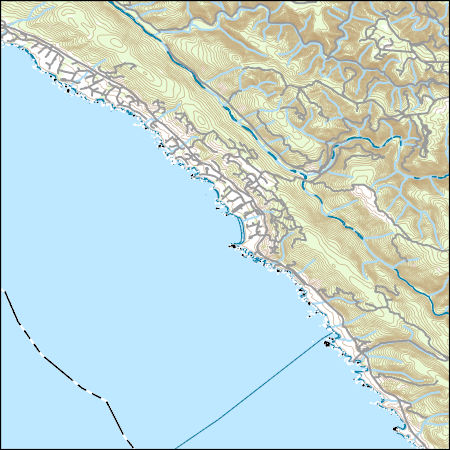
Layers of geospatial data include contours, boundaries, land cover, hydrography, roads, transportation, geographic names, structures, and other selected map features.
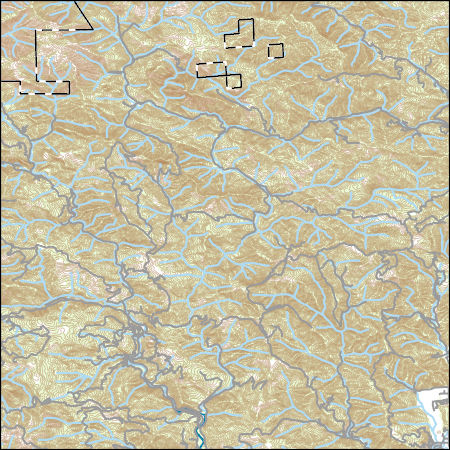
Layers of geospatial data include contours, boundaries, land cover, hydrography, roads, transportation, geographic names, structures, and other selected map features.
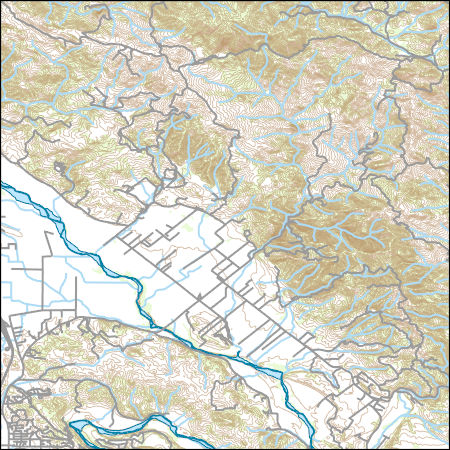
Layers of geospatial data include contours, boundaries, land cover, hydrography, roads, transportation, geographic names, structures, and other selected map features.
Layers of geospatial data include contours, boundaries, land cover, hydrography, roads, transportation, geographic names, structures, and other selected map features.
Layers of geospatial data include contours, boundaries, land cover, hydrography, roads, transportation, geographic names, structures, and other selected map features.
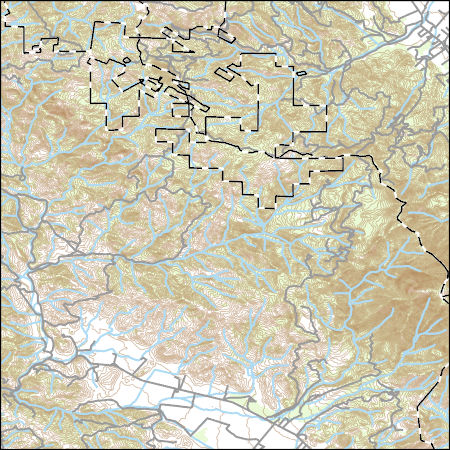
This geologic map database is a reproduction of U.S. Geological Survey Miscellaneous Investigations Map I–2362: “Geologic Map and Structure Sections of the Clear Lake Volcanics, Northern California” (Hearn, Donnelly-Nolan, and Goff, 1995). The database consists of a geologic map, three structural cross sections and a table of petrographic data for each map unit by mineral type, abundance, and size. The Clear Lake Volcanics are in the California Coast Ranges about 150 km north of San Francisco. This Quaternary volcanic field has erupted intermittently since 2.1 million years ago. This volcanic field is considered a high-threat volcanic system (Ewert and others, 2005). The adjacent Geysers geothermal field, the largest...

These data were released prior to the October 1, 2016 effective date for the USGS’s policy dictating the review, approval, and release of scientific data as referenced in USGS Survey Manual Chapter 502.8 Fundamental Science Practices: Review and Approval of Scientific Data for Release. This digital dataset contains the locations of, and links to USGS gages on the surface-water network for the Central Valley Hydrologic Model (CVHM). The Central Valley encompasses an approximate 50,000 square-kilometer region of California. The complex hydrologic system of the Central Valley is simulated using the USGS numerical modeling code MODFLOW-FMP (Schmidt and others, 2006b). This simulation is referred to here as the CVHM...

These data were released prior to the October 1, 2016 effective date for the USGS’s policy dictating the review, approval, and release of scientific data as referenced in USGS Survey Manual Chapter 502.8 Fundamental Science Practices: Review and Approval of Scientific Data for Release. This digital dataset contains the name and location for the diversions from the surface-water network for the Central Valley Hydrologic Model (CVHM). The Central Valley encompasses an approximate 50,000 square-kilometer region of California. The complex hydrologic system of the Central Valley is simulated using the USGS numerical modeling code MODFLOW-FMP (Schmid and others, 2006). This simulation is referred to here as the CVHM...
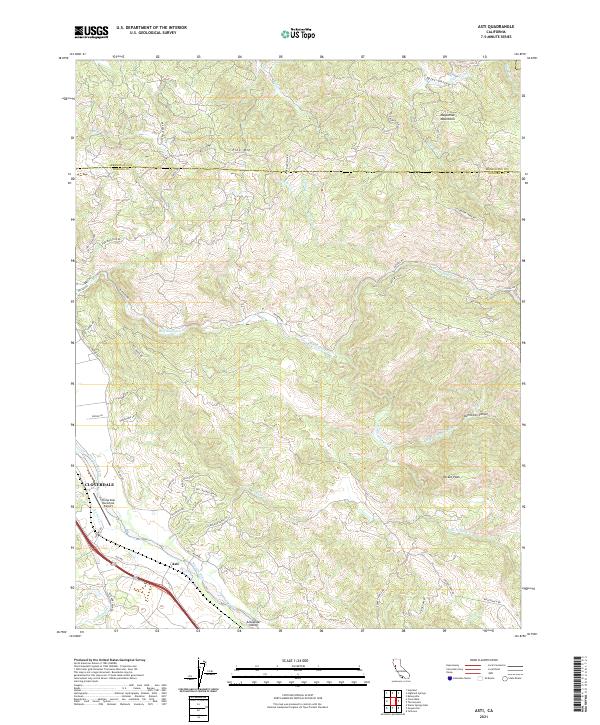
Layered geospatial PDF 7.5 Minute Quadrangle Map. Layers of geospatial data include orthoimagery, roads, grids, geographic names, elevation contours, hydrography, and other selected map features. This map is derived from GIS (geospatial information system) data. It represents a repackaging of GIS data in traditional map form, not creation of new information. The geospatial data in this map are from selected National Map data holdings and other government sources.
This dataset consists of 42 magnetotelluric (MT) stations collected in 2017 in the Northwest Geysers, CA. The U.S. Geological Survey acquired these data as part of a project to image the heat source in the Northwest Geysers. Support was from the U.S. Geological Survey's Volcano Hazards Program.
This dataset consists of 42 magnetotelluric (MT) stations collected in 2017 in the Northwest Geysers, CA. The U.S. Geological Survey acquired these data as part of a project to image the heat source in the Northwest Geysers. Support was from the U.S. Geological Survey's Volcano Hazards Program.
Layered geospatial PDF 7.5 Minute Quadrangle Map. Layers of geospatial data include orthoimagery, roads, grids, geographic names, elevation contours, hydrography, and other selected map features. This map is derived from GIS (geospatial information system) data. It represents a repackaging of GIS data in traditional map form, not creation of new information. The geospatial data in this map are from selected National Map data holdings and other government sources.
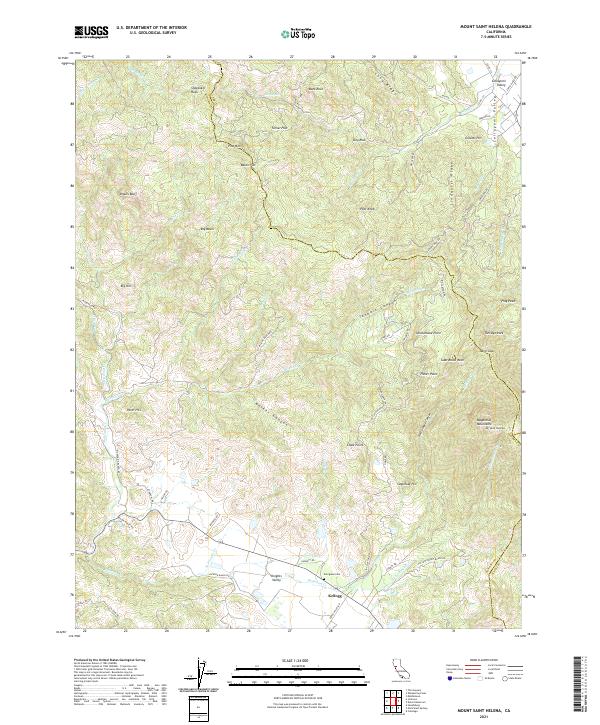
Layered geospatial PDF 7.5 Minute Quadrangle Map. Layers of geospatial data include orthoimagery, roads, grids, geographic names, elevation contours, hydrography, and other selected map features. This map is derived from GIS (geospatial information system) data. It represents a repackaging of GIS data in traditional map form, not creation of new information. The geospatial data in this map are from selected National Map data holdings and other government sources.
Layered geospatial PDF 7.5 Minute Quadrangle Map. Layers of geospatial data include orthoimagery, roads, grids, geographic names, elevation contours, hydrography, and other selected map features. This map is derived from GIS (geospatial information system) data. It represents a repackaging of GIS data in traditional map form, not creation of new information. The geospatial data in this map are from selected National Map data holdings and other government sources.
Layered geospatial PDF 7.5 Minute Quadrangle Map. Layers of geospatial data include orthoimagery, roads, grids, geographic names, elevation contours, hydrography, and other selected map features. This map is derived from GIS (geospatial information system) data. It represents a repackaging of GIS data in traditional map form, not creation of new information. The geospatial data in this map are from selected National Map data holdings and other government sources.
Layered geospatial PDF 7.5 Minute Quadrangle Map. Layers of geospatial data include orthoimagery, roads, grids, geographic names, elevation contours, hydrography, and other selected map features. This map is derived from GIS (geospatial information system) data. It represents a repackaging of GIS data in traditional map form, not creation of new information. The geospatial data in this map are from selected National Map data holdings and other government sources.
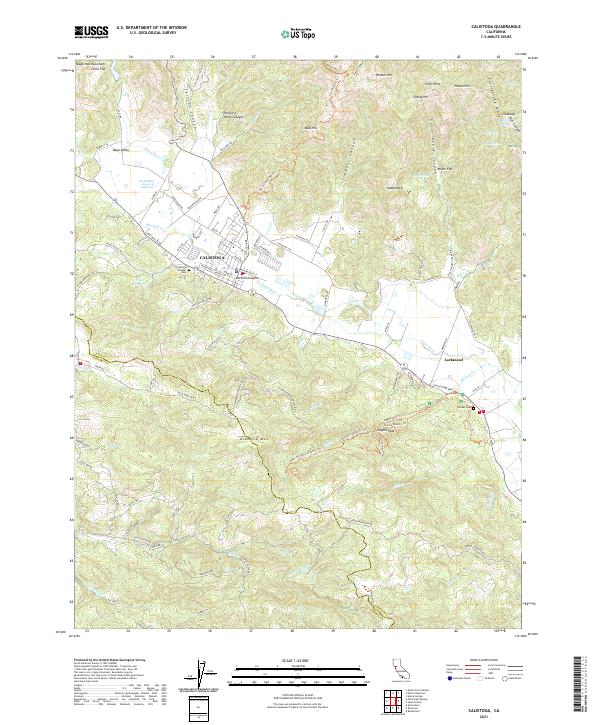
Layered geospatial PDF 7.5 Minute Quadrangle Map. Layers of geospatial data include orthoimagery, roads, grids, geographic names, elevation contours, hydrography, and other selected map features. This map is derived from GIS (geospatial information system) data. It represents a repackaging of GIS data in traditional map form, not creation of new information. The geospatial data in this map are from selected National Map data holdings and other government sources.
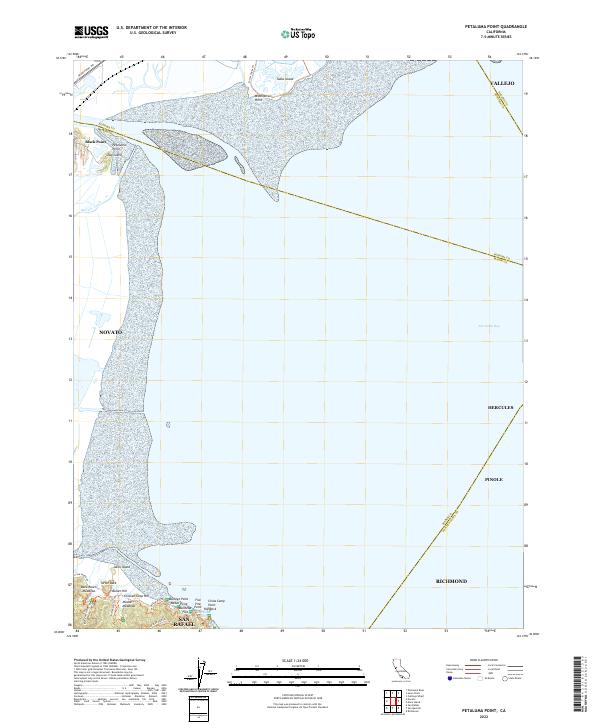
Layered geospatial PDF 7.5 Minute Quadrangle Map. Layers of geospatial data include orthoimagery, roads, grids, geographic names, elevation contours, hydrography, and other selected map features. This map is derived from GIS (geospatial information system) data. It represents a repackaging of GIS data in traditional map form, not creation of new information. The geospatial data in this map are from selected National Map data holdings and other government sources.
Layers of geospatial data include contours, boundaries, land cover, hydrography, roads, transportation, geographic names, structures, and other selected map features.
|

|
