Filters: Tags: Sudbury (X)
9 results (14ms)|
Filters
Date Range
Types Contacts
Tag Types Tag Schemes |
This data release provides a set of Hydrological Simulation Program--Fortran (HSPF) model files representing 5 EPA-selected future climate change scenarios for each of two river basins: Taunton and Sudbury, in Massachusetts. Output from these models are intended for use as input to EPA Watershed Management Optimization Support Tool (WMOST) modeling. Climate scenarios, based on 2036-2065 change from 1975-2004 Representative Concentration Pathways (RCP) 4.5 and 8.5, model effects of air temperature and precipitation changes (in degrees F for air temperature, in percent for precipitation) made to the input historical meteorological time series 1975-2004. Taunton meteorological data is from T.F. Green Airport and the...
Types: Citation;
Tags: Climatology,
Sudbury,
Taunton,
USGS Science Data Catalog (SDC),
Water Resources,
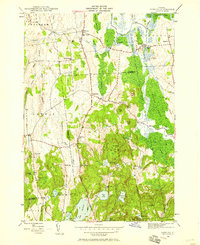
USGS Historical Quadrangle in GeoPDF.
This data set contains imagery from the National Agriculture Imagery Program (NAIP). The NAIP program is administered by USDA FSA and has been established to support two main FSA strategic goals centered on agricultural production. These are increase stewardship of America's natural resources while enhancing the environment, and to ensure commodities are procured and distributed effectively and efficiently to increase food security. The NAIP program supports these goals by acquiring and providing ortho imagery that has been collected during the agricultural growing season in the U.S. The NAIP ortho imagery is tailored to meet FSA requirements and is a fundamental tool used to support FSA farm and conservation programs....
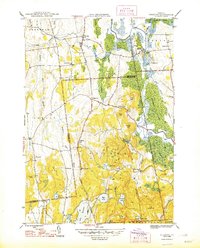
This data set contains imagery from the National Agriculture Imagery Program (NAIP). The NAIP program is administered by USDA FSA and has been established to support two main FSA strategic goals centered on agricultural production. These are increase stewardship of America's natural resources while enhancing the environment, and to ensure commodities are procured and distributed effectively and efficiently to increase food security. The NAIP program supports these goals by acquiring and providing ortho imagery that has been collected during the agricultural growing season in the U.S. The NAIP ortho imagery is tailored to meet FSA requirements and is a fundamental tool used to support FSA farm and conservation programs....
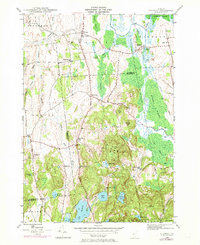
USGS Historical Quadrangle in GeoPDF.
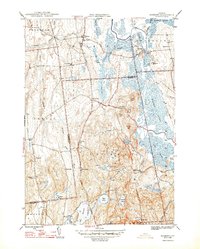
USGS Historical Quadrangle in GeoPDF.
This data set contains imagery from the National Agriculture Imagery Program (NAIP). The NAIP program is administered by USDA FSA and has been established to support two main FSA strategic goals centered on agricultural production. These are increase stewardship of America's natural resources while enhancing the environment, and to ensure commodities are procured and distributed effectively and efficiently to increase food security. The NAIP program supports these goals by acquiring and providing ortho imagery that has been collected during the agricultural growing season in the U.S. The NAIP ortho imagery is tailored to meet FSA requirements and is a fundamental tool used to support FSA farm and conservation programs....
|

|
