Filters: Tags: Suffolk County (X)
264 results (36ms)|
Filters
Date Range
Extensions Types Contacts
Categories Tag Types
|
The combination of a complex hydrogeologic framework, narrow land masses surrounded by saltwater, and extensive ground-water public-supply pumpage has produced localized areas of elevated chloride concentrations in ground water. This project uses advanced surface and borehole geophysical methods to determine the extent of saltwater intrusion and road-salt plumes at selected sites in eastern Suffolk County, Long Island, NY. Two-dimensional resistivity sections have been integrated with borehole geophysical logs and water-quality data to produce cross-sections of road-salt plumes. Borehole geophysical logs are collected twice a year to determine variations in chloride concentration and thicknesses of intrusive...
Categories: Data,
Project;
Types: Downloadable,
Map Service,
OGC WFS Layer,
OGC WMS Layer,
Shapefile;
Tags: Borehole Geophysics,
Borehole Geophysics,
Borehole Geophysics,
Cooperative Water Program,
GW or SW,
The U.S. Geological Survey (USGS) is providing online maps of water-table and potentiometric-surface altitude in the upper glacial, Magothy, Jameco, Lloyd, and North Shore aquifers on Long Island, New York, April–May 2016. Also provided is a depth-to-water map for Long Island, New York, April–May 2016. The USGS makes these maps and geospatial data available as REST Open Map Services (as well as HTTP, JSON, KML, and shapefile), so end-users can consume them on mobile and web clients. A companion report, U.S. Geological Survey Scientific Investigations Map 3398 (Como and others, 2018; https://doi.org/10.3133/sim3398) further describes data collection and map preparation and presents 68x22 in. Portable Document...
Categories: Data;
Types: ArcGIS REST Map Service,
ArcGIS Service Definition,
Citation,
Downloadable,
Map Service;
Tags: Contours,
Groundwater,
Hydrology,
Levels,
Long Island,
Layers of geospatial data include contours, boundaries, land cover, hydrography, roads, transportation, geographic names, structures, and other selected map features.
Types: Citation;
Tags: 7.5 x 7.5 minute,
7_5_Min,
Combined Vector,
Combined Vector,
Combined Vector,

Layers of geospatial data include contours, boundaries, land cover, hydrography, roads, transportation, geographic names, structures, and other selected map features.
Layers of geospatial data include contours, boundaries, land cover, hydrography, roads, transportation, geographic names, structures, and other selected map features.
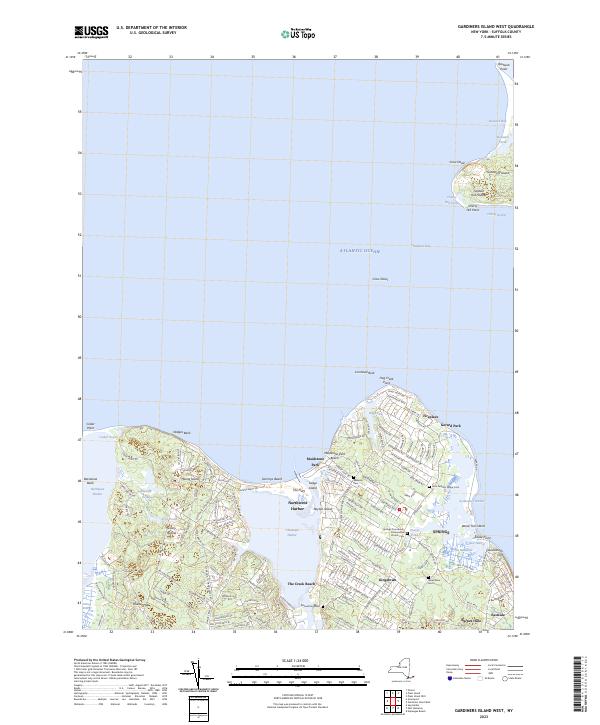
Layered geospatial PDF 7.5 Minute Quadrangle Map. Layers of geospatial data include orthoimagery, roads, grids, geographic names, elevation contours, hydrography, and other selected map features. This map is derived from GIS (geospatial information system) data. It represents a repackaging of GIS data in traditional map form, not creation of new information. The geospatial data in this map are from selected National Map data holdings and other government sources.
Layered geospatial PDF 7.5 Minute Quadrangle Map. Layers of geospatial data include orthoimagery, roads, grids, geographic names, elevation contours, hydrography, and other selected map features. This map is derived from GIS (geospatial information system) data. It represents a repackaging of GIS data in traditional map form, not creation of new information. The geospatial data in this map are from selected National Map data holdings and other government sources.
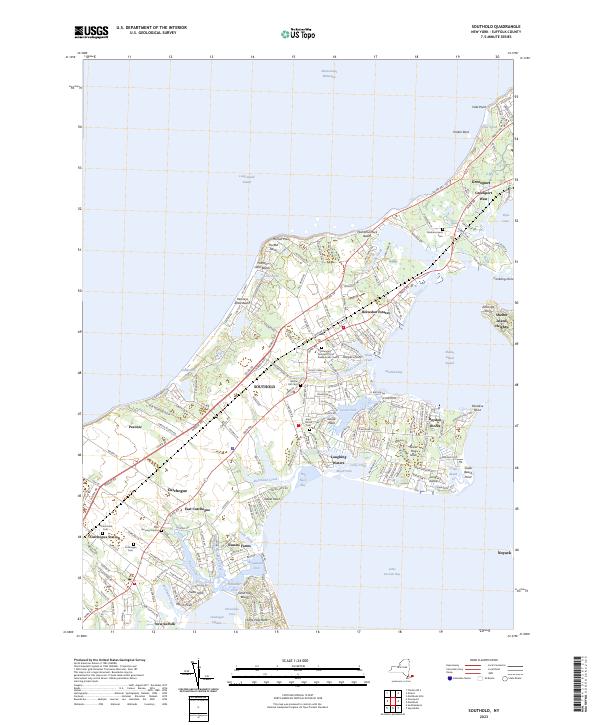
Layered geospatial PDF 7.5 Minute Quadrangle Map. Layers of geospatial data include orthoimagery, roads, grids, geographic names, elevation contours, hydrography, and other selected map features. This map is derived from GIS (geospatial information system) data. It represents a repackaging of GIS data in traditional map form, not creation of new information. The geospatial data in this map are from selected National Map data holdings and other government sources.
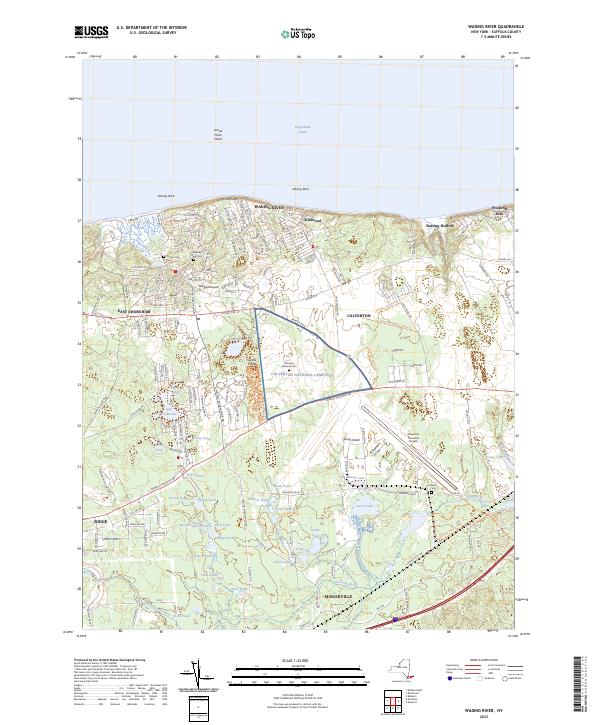
Layered geospatial PDF 7.5 Minute Quadrangle Map. Layers of geospatial data include orthoimagery, roads, grids, geographic names, elevation contours, hydrography, and other selected map features. This map is derived from GIS (geospatial information system) data. It represents a repackaging of GIS data in traditional map form, not creation of new information. The geospatial data in this map are from selected National Map data holdings and other government sources.
Layered geospatial PDF 7.5 Minute Quadrangle Map. Layers of geospatial data include orthoimagery, roads, grids, geographic names, elevation contours, hydrography, and other selected map features. This map is derived from GIS (geospatial information system) data. It represents a repackaging of GIS data in traditional map form, not creation of new information. The geospatial data in this map are from selected National Map data holdings and other government sources.
Layered geospatial PDF 7.5 Minute Quadrangle Map. Layers of geospatial data include orthoimagery, roads, grids, geographic names, elevation contours, hydrography, and other selected map features. This map is derived from GIS (geospatial information system) data. It represents a repackaging of GIS data in traditional map form, not creation of new information. The geospatial data in this map are from selected National Map data holdings and other government sources.
Layered geospatial PDF 7.5 Minute Quadrangle Map. Layers of geospatial data include orthoimagery, roads, grids, geographic names, elevation contours, hydrography, and other selected map features. This map is derived from GIS (geospatial information system) data. It represents a repackaging of GIS data in traditional map form, not creation of new information. The geospatial data in this map are from selected National Map data holdings and other government sources.
This data release contains geospatial data defining estimates of the depth to water and water-table altitude in the upper glacial and Magothy Aquifers, the potentiometric surface of the confined Magothy and Jameco Aquifers, and the potentiometric surface of the Lloyd and North Shore Aquifers on Long Island, New York. Estimates are based on 502 water-level measurements made in wells across Long Island during March-April 2006. Water-table contours were interpolated using measurements from 341 wells screened in the upper glacial aquifer or shallow Magothy Aquifer. Potentiometric-surface contours in the confined Magothy and hydraulically connected Jameco Aquifer were interpolated using measurements from 102 wells. Potentiometric-surface...
This document provides a summary of surface water-quality, streamflow, and groundwater data collected by the U.S. Geological Survey (USGS) within the Central Pine Barrens (CPB) Region of Suffolk County, New York. The data were collected in cooperation with the Central Pine Barrens Commission and the Town of Brookhaven under a five-year comprehensive water resources monitoring program. The surface water-quality data within the CPB for the 2018 water year (October 1, 2017 to September 30, 2018) includes data from the Carmans River and the Peconic River. The streams were sampled several times throughout the year at seven pre-determined locations. The Carmans River was sampled at five locations: 1) CARMANS RIVER AT...
Categories: Data,
Data Release - Revised;
Types: Downloadable,
Map Service,
OGC WFS Layer,
OGC WMS Layer,
Shapefile;
Tags: Carmans River,
Central Pine Barrens,
Long Island,
New York,
Peconic River,
Note: this data release is under revision and is temporarily unavailable. This data release contains coastal wetland synthesis products for the geographic region of eastern Long Island, New York, including the north and south forks, Gardiners Island, and Fishers Island. Metrics for resiliency, including unvegetated to vegetated ratio (UVVR), marsh elevation, and mean tidal range, are calculated for smaller units delineated from a Digital Elevation Model, providing the spatial variability of physical factors that influence wetland health. Through scientific efforts initiated with the Hurricane Sandy Science Plan, the U.S. Geological Survey has been expanding national assessment of coastal change hazards and forecast...
Groundwater samples collected between 2016 and 2018 from 56 shallow (<40 m depth) monitoring wells in Long Island, N.Y., were collected in support of the Long Island Pesticide Pollution Prevention Strategy. Each well was sampled at least once and analyzed for over 200 pesticides and pesticide degradates as part of this study. Results presented here also include field and inorganic analysis data, as well as neonicotinoid (LC9045) and glyphosate pesticide data collected from select monitoring wells. Data collection and analysis was supported by the New York State Department of Environmental Conservation, Suffolk County Department of Health Services, and Long Island Commission for Aquifer Protection. The results presented...
Categories: Data;
Tags: Groundwater-Quality Monitoring,
Long Island,
Nassau County,
New York,
Suffolk County,
This data release contains the input, output, and model code used to run a transient simulation of a previously published (Walter and others, 2020) steady-state regional model of Long Island, N.Y. The original model code was updated to MODFLOW 6 (version 6.3.0) and incorporates monthly transient stress periods to simulate conditions from 2005-2019 following methods described in Walter and others (2020). Selected remedial stresses (groundwater extraction and return) were incorporated for select locations in southeastern Nassau County. No modifications were made to the hydrologic boundaries, model layers, or hydraulic properties specified in the original model. A uniform value of 0.25 was used to represent specific...
Background Borehole drilling and well-installation are costly procedures, and securing funding for new well installation for the sake of research is often difficult.The Suffolk County Water Authority (SCWA) maintains a large network of deep wells for public supply that is constantly being upgraded as water demands increase. During the drilling process, contractors record drillers’ logs and collect cores and, subsequently, often perform borehole geophysical logging for determination of aquifer properties. However, although these data may suffice for selecting a screen zone, they are lacking in more detailed hydrologic information necessary for a better understanding of Suffolk County’s hydrologic...
Categories: Data,
Project;
Types: Downloadable,
Map Service,
OGC WFS Layer,
OGC WMS Layer,
Shapefile;
Tags: Borehole Geophysics,
Borehole Geophysics,
Borehole Geophysics,
Cooperative Water Program,
GW or SW,
The Bathymetry surface was created by plotting depths of all data points collected relative to North American Vertical Datum of 1988 (NAVD 88), which was converted using the Vertical Datum Transformation tool created by the National Oceanic and Atmospheric Administration's (NOAA) National Geodetic Survey, Office of Coast Survey, and Center for Operation Oceanographic Products and Services. The elevation of the bathymetric raster surface was interpolated between these points in a GIS using a spline interpolator. A total of 432 points were used for interpolation. The points were used as the input to create a polygon feature class. The Spline tool was applied using the points and polygon to interpolate the bathymetric...
Categories: Data;
Types: Downloadable,
Map Service,
OGC WFS Layer,
OGC WMS Layer,
Shapefile;
Tags: Acoustic Doppler Current Profiler,
Bathymetry,
Breach,
Fire Island National Seashore,
Long Island,
Layers of geospatial data include contours, boundaries, land cover, hydrography, roads, transportation, geographic names, structures, and other selected map features.
|

|
