Filters: Tags: Sullivan County (X)
433 results (13ms)|
Filters
Date Range
Extensions (Less) Types (Less)
Contacts (Less)
Categories (Less) Tag Types
|
From 2013 to 2015, bathymetric surveys of New York City’s six West of Hudson reservoirs (Ashokan, Cannonsville, Neversink, Pepacton, Rondout, and Schoharie) were performed to provide updated capacity tables and bathymetric maps. Depths were surveyed with a single-beam echo sounder and real-time kinematic global positioning system (RTK-GPS) along planned transects at predetermined intervals for each reservoir. A separate set of echo sounder data was collected along transects at oblique angles to the main transects for accuracy assessment. Field survey data was combined with water-surface elevations in a geographic information system to create three-dimensional surfaces representing reservoir-bed elevations in the...
Types: Citation;
Tags: GPS measurement,
Neversink Reservoir,
Sullivan County,
bathymetry,
single-beam echo sounder
From 2013 to 2015, bathymetric surveys of New York City’s six West of Hudson reservoirs (Ashokan, Cannonsville, Neversink, Pepacton, Rondout, and Schoharie) were performed to provide updated capacity tables and bathymetric maps. Depths were surveyed with a single-beam echo sounder and real-time kinematic global positioning system (RTK-GPS) along planned transects at predetermined intervals for each reservoir. A separate set of echo sounder data was collected along transects at oblique angles to the main transects for accuracy assessment. Field survey data was combined with water-surface elevations in a geographic information system to create three-dimensional surfaces representing reservoir-bed elevations in the...
Categories: Data;
Types: Citation,
Downloadable,
Map Service,
OGC WFS Layer,
OGC WMS Layer,
Shapefile;
Tags: GPS measurement,
Rondout Reservoir,
Sullivan County,
Ulster County,
bathymetry,
Layers of geospatial data include contours, boundaries, land cover, hydrography, roads, transportation, geographic names, structures, and other selected map features.
Floating transient electromagnetic (FloaTEM) surveys in the Delaware River near Barryville, New York
Floating transient electromagnetic (FloaTEM) data were acquired on the Upper Delaware River during December 2018. During the survey, approximately 10 line-kilometers were collected in the Upper Delaware River, near USGS boring 12008-14 (https://webapps.usgs.gov/GeoLogLocator/#!/search) near Barryville, New York study area. Data were collected by members of the U.S. Geological Survey, Hydrogeophysics Branch, New England Water Science Center, and the National Park Service UPDE. FloaTEM data acquired along the Delaware River in Sullivan County, in New York, were collected to test a new continuous water-borne transient electromagnetic data collection platform, and to characterize the subsurface resistivity structure....
Layered geospatial PDF 7.5 Minute Quadrangle Map. Layers of geospatial data include orthoimagery, roads, grids, geographic names, elevation contours, hydrography, and other selected map features. This map is derived from GIS (geospatial information system) data. It represents a repackaging of GIS data in traditional map form, not creation of new information. The geospatial data in this map are from selected National Map data holdings and other government sources.
Layered geospatial PDF 7.5 Minute Quadrangle Map. Layers of geospatial data include orthoimagery, roads, grids, geographic names, elevation contours, hydrography, and other selected map features. This map is derived from GIS (geospatial information system) data. It represents a repackaging of GIS data in traditional map form, not creation of new information. The geospatial data in this map are from selected National Map data holdings and other government sources.
Layered geospatial PDF 7.5 Minute Quadrangle Map. Layers of geospatial data include orthoimagery, roads, grids, geographic names, elevation contours, hydrography, and other selected map features. This map is derived from GIS (geospatial information system) data. It represents a repackaging of GIS data in traditional map form, not creation of new information. The geospatial data in this map are from selected National Map data holdings and other government sources.
Layered geospatial PDF 7.5 Minute Quadrangle Map. Layers of geospatial data include orthoimagery, roads, grids, geographic names, elevation contours, hydrography, and other selected map features. This map is derived from GIS (geospatial information system) data. It represents a repackaging of GIS data in traditional map form, not creation of new information. The geospatial data in this map are from selected National Map data holdings and other government sources.
Layered geospatial PDF 7.5 Minute Quadrangle Map. Layers of geospatial data include orthoimagery, roads, grids, geographic names, elevation contours, hydrography, and other selected map features. This map is derived from GIS (geospatial information system) data. It represents a repackaging of GIS data in traditional map form, not creation of new information. The geospatial data in this map are from selected National Map data holdings and other government sources.
Layered geospatial PDF 7.5 Minute Quadrangle Map. Layers of geospatial data include orthoimagery, roads, grids, geographic names, elevation contours, hydrography, and other selected map features. This map is derived from GIS (geospatial information system) data. It represents a repackaging of GIS data in traditional map form, not creation of new information. The geospatial data in this map are from selected National Map data holdings and other government sources.
Layered geospatial PDF 7.5 Minute Quadrangle Map. Layers of geospatial data include orthoimagery, roads, grids, geographic names, elevation contours, hydrography, and other selected map features. This map is derived from GIS (geospatial information system) data. It represents a repackaging of GIS data in traditional map form, not creation of new information. The geospatial data in this map are from selected National Map data holdings and other government sources.
Layered geospatial PDF 7.5 Minute Quadrangle Map. Layers of geospatial data include orthoimagery, roads, grids, geographic names, elevation contours, hydrography, and other selected map features. This map is derived from GIS (geospatial information system) data. It represents a repackaging of GIS data in traditional map form, not creation of new information. The geospatial data in this map are from selected National Map data holdings and other government sources.
Groundwater quality data for 472 domestic well-water samples were retrieved from the USGS National Water Information System (NWIS) database and combined with descriptive information on the sampled well locations. The NWIS data for a sample, collected on the selected date, were averaged into a single record (one per well), and rounded according to USGS protocols. For evaluation and reporting, the water-quality data were further combined with physical attributes and classified by lithology, topographic position, physiographic province, region, redox, and pH (as standalone matrix, one row per well). A second data matrix file incorporating minimum reporting levels for censored and low-reported values (set to 0.99X highest...
Categories: Data;
Tags: Bradford County,
Clinton County,
Geochemistry,
Groundwater Quality,
Hydrology,
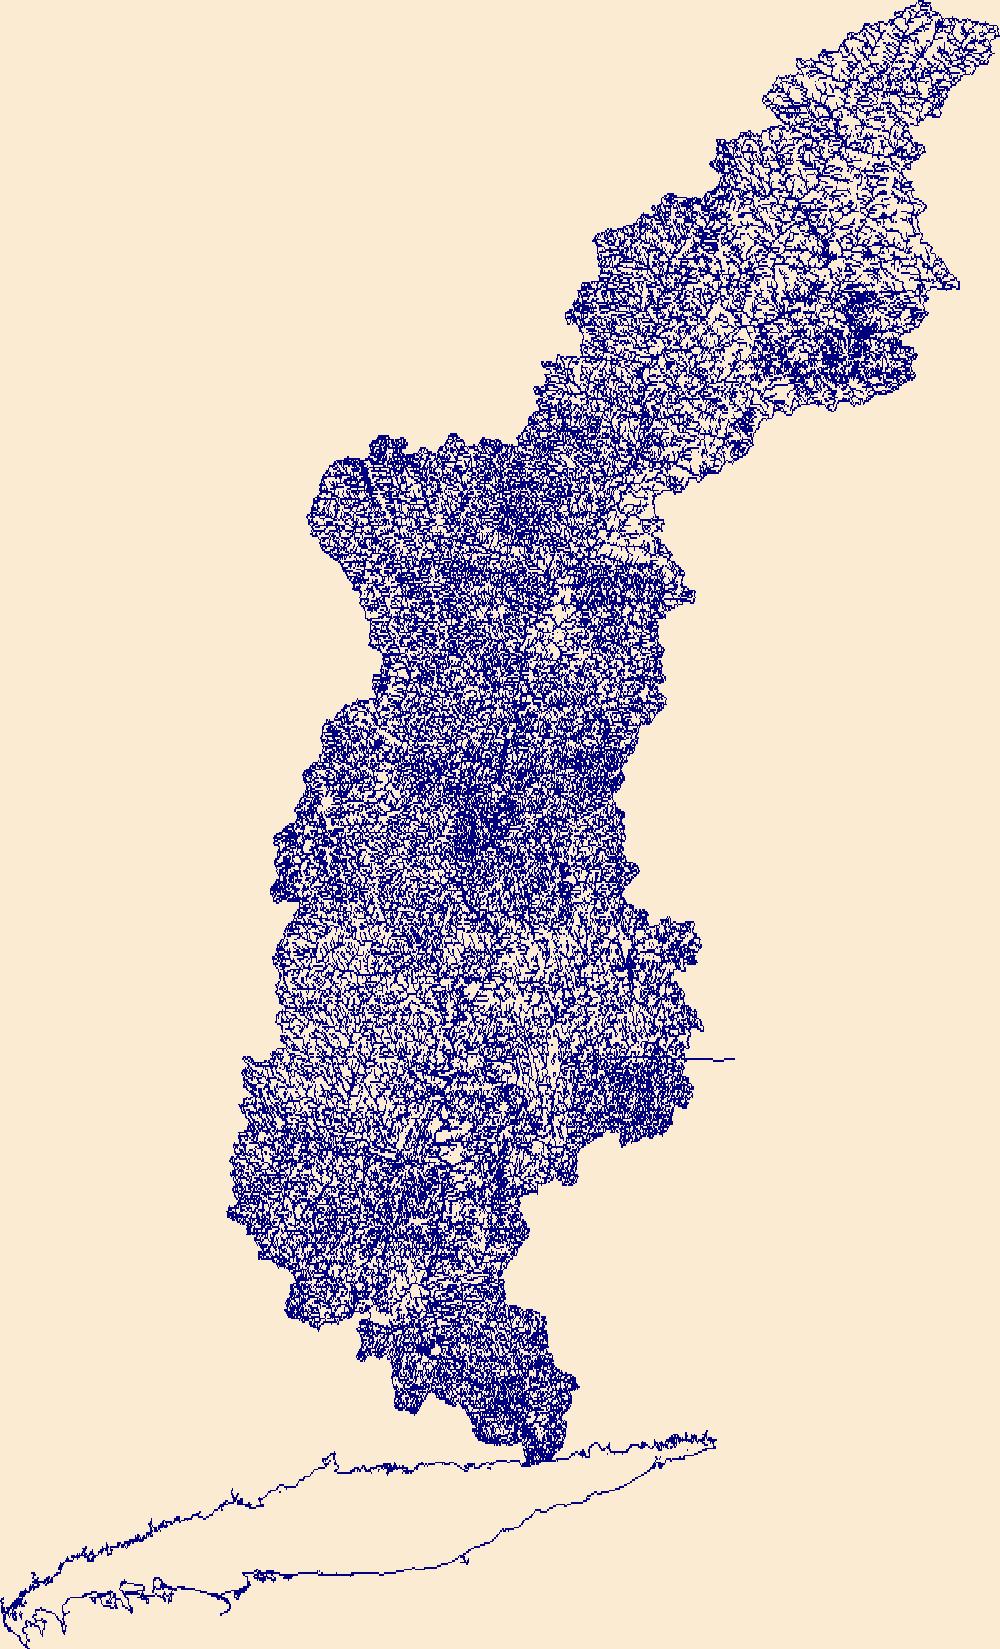
The High Resolution National Hydrography Dataset Plus (NHDPlus HR) is an integrated set of geospatial data layers, including the National Hydrography Dataset (NHD), National Watershed Boundary Dataset (WBD), and 3D Elevation Program Digital Elevation Model (3DEP DEM). The NHDPlus HR combines the NHD, 3DEP DEMs, and WBD to a data suite that includes the NHD stream network with linear referencing functionality, the WBD hydrologic units, elevation-derived catchment areas for each stream segment, "value added attributes" (VAAs), and other features that enhance hydrologic data analysis and routing.
Digital hydrogeologic datasets were developed for the Rondout-Neversink study area in upstate New York in cooperation with the New York State Department of Environmental Conservation. These datasets define the hydrogeologic framework of the valley-fill aquifer and surrounding till-covered uplands within the study area. Datasets include: bedrock elevation raster, lacustrine silt and clay top and bottom elevation rasters, lidar minimum elevation raster, lacustrine extent polygon, valley-fill extent polygon, and surficial geology polygons. Elevation layers were interpolated at 125-foot discretization to match the model grid cell size.
Layered geospatial PDF 7.5 Minute Quadrangle Map. Layers of geospatial data include orthoimagery, roads, grids, geographic names, elevation contours, hydrography, and other selected map features. This map is derived from GIS (geospatial information system) data. It represents a repackaging of GIS data in traditional map form, not creation of new information. The geospatial data in this map are from selected National Map data holdings and other government sources.
Layered geospatial PDF 7.5 Minute Quadrangle Map. Layers of geospatial data include orthoimagery, roads, grids, geographic names, elevation contours, hydrography, and other selected map features. This map is derived from GIS (geospatial information system) data. It represents a repackaging of GIS data in traditional map form, not creation of new information. The geospatial data in this map are from selected National Map data holdings and other government sources.
Layered geospatial PDF 7.5 Minute Quadrangle Map. Layers of geospatial data include orthoimagery, roads, grids, geographic names, elevation contours, hydrography, and other selected map features. This map is derived from GIS (geospatial information system) data. It represents a repackaging of GIS data in traditional map form, not creation of new information. The geospatial data in this map are from selected National Map data holdings and other government sources.
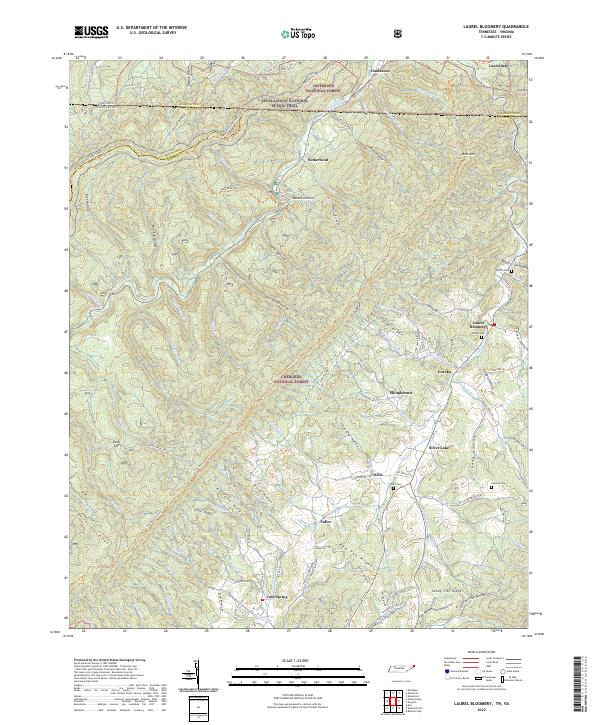
Layered geospatial PDF 7.5 Minute Quadrangle Map. Layers of geospatial data include orthoimagery, roads, grids, geographic names, elevation contours, hydrography, and other selected map features. This map is derived from GIS (geospatial information system) data. It represents a repackaging of GIS data in traditional map form, not creation of new information. The geospatial data in this map are from selected National Map data holdings and other government sources.
Layers of geospatial data include contours, boundaries, land cover, hydrography, roads, transportation, geographic names, structures, and other selected map features.
|

|
