Filters: Tags: Temperature (X) > partyWithName: Healy Hamilton (X)
329 results (9ms)|
Filters
Date Range
Tag Schemes |

Using the simple anomaly method (modifying a historical baseline with differences or ratios projected by General Circulation Models), scientists from the California Academy of Sciences downscaled monthly average temperature and monthly total precipitation from 16 different global circulation models (GCMs). The GCMs were described in the latest Intergovernmental Panel for Climate Change (IPCC 2007) and archived at the WCRP PCMDI (http://www-pcmdi.llnl.gov/ipcc/about_ipcc.php). Monthly maximum temperature and monthly minimum temperatures were downscaled from the only 6 GCMs that archived these particular variables. Scientists used Worldclim v.1.4 (Hijmans et al 2005) at 5 arc-minute (~10km) spatial grain as the current...

Using the simple anomaly method (modifying a historical baseline with differences or ratios projected by General Circulation Models), scientists from the California Academy of Sciences downscaled monthly average temperature and monthly total precipitation from 16 different global circulation models (GCMs). The GCMs were described in the latest Intergovernmental Panel for Climate Change (IPCC 2007) and archived at the WCRP PCMDI (http://www-pcmdi.llnl.gov/ipcc/about_ipcc.php). Monthly maximum temperature and monthly minimum temperatures were downscaled from the only 6 GCMs that archived these particular variables. Scientists used Worldclim v.1.4 (Hijmans et al 2005) at 5 arc-minute (~10km) spatial grain as the current...

Using the simple anomaly method (modifying a historical baseline with differences or ratios projected by General Circulation Models), scientists from the California Academy of Sciences downscaled monthly average temperature and monthly total precipitation from 16 different global circulation models (GCMs). The GCMs were described in the latest Intergovernmental Panel for Climate Change (IPCC 2007) and archived at the WCRP PCMDI (http://www-pcmdi.llnl.gov/ipcc/about_ipcc.php). Monthly maximum temperature and monthly minimum temperatures were downscaled from the only 6 GCMs that archived these particular variables. Scientists used Worldclim v.1.4 (Hijmans et al 2005) at 5 arc-minute (~10km) spatial grain as the current...

Using the simple anomaly method (modifying a historical baseline with differences or ratios projected by General Circulation Models), scientists from the California Academy of Sciences downscaled monthly average temperature and monthly total precipitation from 16 different global circulation models (GCMs). The GCMs were described in the latest Intergovernmental Panel for Climate Change (IPCC 2007) and archived at the WCRP PCMDI (http://www-pcmdi.llnl.gov/ipcc/about_ipcc.php). Monthly maximum temperature and monthly minimum temperatures were downscaled from the only 6 GCMs that archived these particular variables. Scientists used Worldclim v.1.4 (Hijmans et al 2005) at 5 arc-minute (~10km) spatial grain as the current...
Using the simple anomaly method (modifying a historical baseline with differences or ratios projected by General Circulation Models), scientists from the California Academy of Sciences downscaled monthly average temperature and monthly total precipitation from 16 different global circulation models (GCMs). The GCMs were described in the latest Intergovernmental Panel for Climate Change (IPCC 2007) and archived at the WCRP PCMDI (http://www-pcmdi.llnl.gov/ipcc/about_ipcc.php). Monthly maximum temperature and monthly minimum temperatures were downscaled from the only 6 GCMs that archived these particular variables. Scientists used Worldclim v.1.4 (Hijmans et al 2005) at 5 arc-minute (~10km) spatial grain as the current...

Using the simple anomaly method (modifying a historical baseline with differences or ratios projected by General Circulation Models), scientists from the California Academy of Sciences downscaled monthly average temperature and monthly total precipitation from 16 different global circulation models (GCMs). The GCMs were described in the latest Intergovernmental Panel for Climate Change (IPCC 2007) and archived at the WCRP PCMDI (http://www-pcmdi.llnl.gov/ipcc/about_ipcc.php). Monthly maximum temperature and monthly minimum temperatures were downscaled from the only 6 GCMs that archived these particular variables. Scientists used Worldclim v.1.4 (Hijmans et al 2005) at 5 arc-minute (~10km) spatial grain as the current...

Using the simple anomaly method (modifying a historical baseline with differences or ratios projected by General Circulation Models), scientists from the California Academy of Sciences downscaled monthly average temperature and monthly total precipitation from 16 different global circulation models (GCMs). The GCMs were described in the latest Intergovernmental Panel for Climate Change (IPCC 2007) and archived at the WCRP PCMDI (http://www-pcmdi.llnl.gov/ipcc/about_ipcc.php). Monthly maximum temperature and monthly minimum temperatures were downscaled from the only 6 GCMs that archived these particular variables. Scientists used Worldclim v.1.4 (Hijmans et al 2005) at 5 arc-minute (~10km) spatial grain as the current...

Using the simple anomaly method (modifying a historical baseline with differences or ratios projected by General Circulation Models), scientists from the California Academy of Sciences downscaled monthly average temperature and monthly total precipitation from 16 different global circulation models (GCMs). The GCMs were described in the latest Intergovernmental Panel for Climate Change (IPCC 2007) and archived at the WCRP PCMDI (http://www-pcmdi.llnl.gov/ipcc/about_ipcc.php). Monthly maximum temperature and monthly minimum temperatures were downscaled from the only 6 GCMs that archived these particular variables. Scientists used Worldclim v.1.4 (Hijmans et al 2005) at 5 arc-minute (~10km) spatial grain as the current...

Using the simple anomaly method (modifying a historical baseline with differences or ratios projected by General Circulation Models), scientists from the California Academy of Sciences downscaled monthly average temperature and monthly total precipitation from 16 different global circulation models (GCMs). The GCMs were described in the latest Intergovernmental Panel for Climate Change (IPCC 2007) and archived at the WCRP PCMDI (http://www-pcmdi.llnl.gov/ipcc/about_ipcc.php). Monthly maximum temperature and monthly minimum temperatures were downscaled from the only 6 GCMs that archived these particular variables. Scientists used Worldclim v.1.4 (Hijmans et al 2005) at 5 arc-minute (~10km) spatial grain as the current...

Using the simple anomaly method (modifying a historical baseline with differences or ratios projected by General Circulation Models), scientists from the California Academy of Sciences downscaled monthly average temperature and monthly total precipitation from 16 different global circulation models (GCMs). The GCMs were described in the latest Intergovernmental Panel for Climate Change (IPCC 2007) and archived at the WCRP PCMDI (http://www-pcmdi.llnl.gov/ipcc/about_ipcc.php). Monthly maximum temperature and monthly minimum temperatures were downscaled from the only 6 GCMs that archived these particular variables. Scientists used Worldclim v.1.4 (Hijmans et al 2005) at 5 arc-minute (~10km) spatial grain as the current...

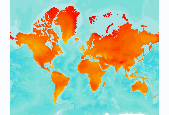
Standard deviation for winter minimum temperature (Celsius), 2060-2079, 6 GCMs, B1 emission scenario
Using the simple anomaly method (modifying a historical baseline with differences or ratios projected by General Circulation Models), scientists from the California Academy of Sciences downscaled monthly average temperature and monthly total precipitation from 16 different global circulation models (GCMs). The GCMs were described in the latest Intergovernmental Panel for Climate Change (IPCC 2007) and archived at the WCRP PCMDI (http://www-pcmdi.llnl.gov/ipcc/about_ipcc.php). Monthly maximum temperature and monthly minimum temperatures were downscaled from the only 6 GCMs that archived these particular variables. Scientists used Worldclim v.1.4 (Hijmans et al 2005) at 5 arc-minute (~10km) spatial grain as the current...

Using the simple anomaly method (modifying a historical baseline with differences or ratios projected by General Circulation Models), scientists from the California Academy of Sciences downscaled monthly average temperature and monthly total precipitation from 16 different global circulation models (GCMs). The GCMs were described in the latest Intergovernmental Panel for Climate Change (IPCC 2007) and archived at the WCRP PCMDI (http://www-pcmdi.llnl.gov/ipcc/about_ipcc.php). Monthly maximum temperature and monthly minimum temperatures were downscaled from the only 6 GCMs that archived these particular variables. Scientists used Worldclim v.1.4 (Hijmans et al 2005) at 5 arc-minute (~10km) spatial grain as the current...

Using the simple anomaly method (modifying a historical baseline with differences or ratios projected by General Circulation Models), scientists from the California Academy of Sciences downscaled monthly average temperature and monthly total precipitation from 16 different global circulation models (GCMs). The GCMs were described in the latest Intergovernmental Panel for Climate Change (IPCC 2007) and archived at the WCRP PCMDI (http://www-pcmdi.llnl.gov/ipcc/about_ipcc.php). Monthly maximum temperature and monthly minimum temperatures were downscaled from the only 6 GCMs that archived these particular variables. Scientists used Worldclim v.1.4 (Hijmans et al 2005) at 5 arc-minute (~10km) spatial grain as the current...

Using the simple anomaly method (modifying a historical baseline with differences or ratios projected by General Circulation Models), scientists from the California Academy of Sciences downscaled monthly average temperature and monthly total precipitation from 16 different global circulation models (GCMs). The GCMs were described in the latest Intergovernmental Panel for Climate Change (IPCC 2007) and archived at the WCRP PCMDI (http://www-pcmdi.llnl.gov/ipcc/about_ipcc.php). Monthly maximum temperature and monthly minimum temperatures were downscaled from the only 6 GCMs that archived these particular variables. Scientists used Worldclim v.1.4 (Hijmans et al 2005) at 5 arc-minute (~10km) spatial grain as the current...

Using the simple anomaly method (modifying a historical baseline with differences or ratios projected by General Circulation Models), scientists from the California Academy of Sciences downscaled monthly average temperature and monthly total precipitation from 16 different global circulation models (GCMs). The GCMs were described in the latest Intergovernmental Panel for Climate Change (IPCC 2007) and archived at the WCRP PCMDI (http://www-pcmdi.llnl.gov/ipcc/about_ipcc.php). Monthly maximum temperature and monthly minimum temperatures were downscaled from the only 6 GCMs that archived these particular variables. Scientists used Worldclim v.1.4 (Hijmans et al 2005) at 5 arc-minute (~10km) spatial grain as the current...

Using the simple anomaly method (modifying a historical baseline with differences or ratios projected by General Circulation Models), scientists from the California Academy of Sciences downscaled monthly average temperature and monthly total precipitation from 16 different global circulation models (GCMs). The GCMs were described in the latest Intergovernmental Panel for Climate Change (IPCC 2007) and archived at the WCRP PCMDI (http://www-pcmdi.llnl.gov/ipcc/about_ipcc.php). Monthly maximum temperature and monthly minimum temperatures were downscaled from the only 6 GCMs that archived these particular variables. Scientists used Worldclim v.1.4 (Hijmans et al 2005) at 5 arc-minute (~10km) spatial grain as the current...

Using the simple anomaly method (modifying a historical baseline with differences or ratios projected by General Circulation Models), scientists from the California Academy of Sciences downscaled monthly average temperature and monthly total precipitation from 16 different global circulation models (GCMs). The GCMs were described in the latest Intergovernmental Panel for Climate Change (IPCC 2007) and archived at the WCRP PCMDI (http://www-pcmdi.llnl.gov/ipcc/about_ipcc.php). Monthly maximum temperature and monthly minimum temperatures were downscaled from the only 6 GCMs that archived these particular variables. Scientists used Worldclim v.1.4 (Hijmans et al 2005) at 5 arc-minute (~10km) spatial grain as the current...

Standard deviation for winter minimum temperature (Celsius), 2020-2039, 6 GCMs, A2 emission scenario
Using the simple anomaly method (modifying a historical baseline with differences or ratios projected by General Circulation Models), scientists from the California Academy of Sciences downscaled monthly average temperature and monthly total precipitation from 16 different global circulation models (GCMs). The GCMs were described in the latest Intergovernmental Panel for Climate Change (IPCC 2007) and archived at the WCRP PCMDI (http://www-pcmdi.llnl.gov/ipcc/about_ipcc.php). Monthly maximum temperature and monthly minimum temperatures were downscaled from the only 6 GCMs that archived these particular variables. Scientists used Worldclim v.1.4 (Hijmans et al 2005) at 5 arc-minute (~10km) spatial grain as the current...

Standard deviation for spring minimum temperature (Celsius), 2060-2079, 6 GCMs, A2 emission scenario
Using the simple anomaly method (modifying a historical baseline with differences or ratios projected by General Circulation Models), scientists from the California Academy of Sciences downscaled monthly average temperature and monthly total precipitation from 16 different global circulation models (GCMs). The GCMs were described in the latest Intergovernmental Panel for Climate Change (IPCC 2007) and archived at the WCRP PCMDI (http://www-pcmdi.llnl.gov/ipcc/about_ipcc.php). Monthly maximum temperature and monthly minimum temperatures were downscaled from the only 6 GCMs that archived these particular variables. Scientists used Worldclim v.1.4 (Hijmans et al 2005) at 5 arc-minute (~10km) spatial grain as the current...

Standard deviation for summer maximum temperature (Celsius), 2060-2079, 6 GCMs, B1 emission scenario
Using the simple anomaly method (modifying a historical baseline with differences or ratios projected by General Circulation Models), scientists from the California Academy of Sciences downscaled monthly average temperature and monthly total precipitation from 16 different global circulation models (GCMs). The GCMs were described in the latest Intergovernmental Panel for Climate Change (IPCC 2007) and archived at the WCRP PCMDI (http://www-pcmdi.llnl.gov/ipcc/about_ipcc.php). Monthly maximum temperature and monthly minimum temperatures were downscaled from the only 6 GCMs that archived these particular variables. Scientists used Worldclim v.1.4 (Hijmans et al 2005) at 5 arc-minute (~10km) spatial grain as the current...
|

|
