Filters: Tags: The Nature Conservancy (X)
183 results (22ms)|
Filters
Date Range
Extensions (Less) Types (Less)
Contacts (Less)
Categories (Less) Tag Types
|
Using funds from an NRDAR settlement, FWS obligated $557,810 ($2011) to TNC of Massachusetts for the purchase of permanent conservation easements on approximately 200 acres of riparian lands along the Housatonic River in Salisbury, Connecticut. Conservation of riparian habitat will help to (1) protect water quality; (2) protect nesting habitat for migratory songbirds and other wildlife, including several rare and endangered plants, turtles, salamanders and dragonflies; and (3) maintain the scenic, agrarian character of the region. These efforts provide a beneficial tradeoff from the harm to the river and associated wildlife caused by historical polychlorinated biphenyls (PCBs) contamination. Economic Impacts of...
Categories: Project;
Types: Map Service,
OGC WFS Layer,
OGC WMS Layer,
OGC WMS Service;
Tags: Amphibians,
Bank stabilization/erosion control,
Birds,
Connecticut,
Farmland Preservation,

Relative abundance of salt marsh habitat, by marine ecoregion. We compiled a global database on salt marshes in collaboration with UNEP-WCMC and with input from Paul Adam, University of New South Wales, Australia. In this database, habitat abundance was estimated using the array of point locations and GIS data holdings from this database and were broadly based on abundance as a proportion of the total coastline length in each ecoregion. Salt marshes were poorly covered in the literature for some parts of the Arctic coastline and from wide areas of the tropics where salt marshes were often overlooked or classified within mangrove areas. While efforts were made to target data searching for these regions, there may...
Number of amphibian species, by freshwater ecoregion. We calculated the number of amphibian species per freshwater ecoregion using species range maps of the Global Amphibian Assessment (GAA, www.iucnredlist.org/amphibians) (IUCN et al. 2006). The 2006 GAA assessed 5,918 amphibian species and provided distribution maps for 5,640 of those species. When a range overlapped several ecoregions, we counted species as present in all those ecoregions that had part of the range. This may have resulted in an overestimate of species numbers in some ecoregions, especially those that are long and narrow in shape. This is particularly true for the Amazonas High Andes ecoregion (312), where the mountain range has been used as...
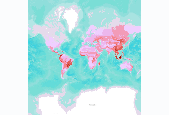
Number of globally threatened animals, by terrestrial ecoregion. We compiled a vertebrate species list for each ecoregion from WWF’s WildFinder database (WWF 2006). This list was then compared against the IUCN Red List of Threatened Species (2008) to determine the number of species per ecoregion that are threatened. Threatened species are those listed by IUCN Red List as Vulnerable, Endangered, or Critically Endangered (www.redlist.org). These data were derived by The Nature Conservancy, and were displayed in a map published in The Atlas of Global Conservation (Hoekstra et al., University of California Press, 2010). More information at http://nature.org/atlas. Data derived from: World Wildlife Fund (WWF). 2006....

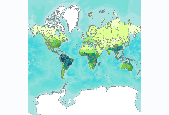
Number of mammal species, by terrestrial ecoregion. We compiled data on terrestrial mammals by querying the WWF WildFinder database for species occurrences by ecoregion. The WWF WildFinder database is a spatially explicit online database of vertebrate species occurrences by ecoregion. These data were displayed in a map published in The Atlas of Global Conservation (Hoekstra et al., University of California Press, 2010). More information at http://nature.org/atlas.
Provisional Tennessee State Wildlife Action Plan (TN-SWAP) terrestrial habitat priorities versus results of the population growth model developed by the Tennessee Chapter of The Nature Conservancy, 2008, converted to percent projected developed landcover in the year 2040. Spatial growth model was developed using population growth projections from the University of Tennessee Center for Business and Economic Research (UT-CBER), county urban growth boundaries, 2000 census blocks, and various ancillary datasets.
Categories: Data;
Tags: Academics & scientific researchers,
AppLCC,
Appalachian,
Conservation NGOs,
Data,
This shapefile represents The Nature Conservancy’s (TNC) “essential forests” and “key connectors” in the Central Appalachians Whole System. Essential Forests are built around groups of large forest patches, ecoregional portfolio roll-up sites, and areas with high local integrity and high flow density (from M. Anderson’s resiliency analysis). Key Connectors provide physical linkages among essential forests, have high flow density, and may also include large forest patches and matrix blocks. The polygons were originally delineated by TNC staff at a workshop near Petersburg, West Virginia, on March 9 and 10, 2011. The boundaries were hand-drawn on paper maps and then hand-digitized by A. Watland (TNC-VA) and T. Gagnolet...
|

|
