Filters: Tags: Thurston County (X)
137 results (85ms)|
Filters
Date Range
Extensions Types
Contacts
Categories Tag Types Tag Schemes |
Layered geospatial PDF 7.5 Minute Quadrangle Map. Layers of geospatial data include orthoimagery, roads, grids, geographic names, elevation contours, hydrography, and other selected map features. This map is derived from GIS (geospatial information system) data. It represents a repackaging of GIS data in traditional map form, not creation of new information. The geospatial data in this map are from selected National Map data holdings and other government sources.
Layered geospatial PDF 7.5 Minute Quadrangle Map. Layers of geospatial data include orthoimagery, roads, grids, geographic names, elevation contours, hydrography, and other selected map features. This map is derived from GIS (geospatial information system) data. It represents a repackaging of GIS data in traditional map form, not creation of new information. The geospatial data in this map are from selected National Map data holdings and other government sources.
Layered geospatial PDF 7.5 Minute Quadrangle Map. Layers of geospatial data include orthoimagery, roads, grids, geographic names, elevation contours, hydrography, and other selected map features. This map is derived from GIS (geospatial information system) data. It represents a repackaging of GIS data in traditional map form, not creation of new information. The geospatial data in this map are from selected National Map data holdings and other government sources.
Layered geospatial PDF 7.5 Minute Quadrangle Map. Layers of geospatial data include orthoimagery, roads, grids, geographic names, elevation contours, hydrography, and other selected map features. This map is derived from GIS (geospatial information system) data. It represents a repackaging of GIS data in traditional map form, not creation of new information. The geospatial data in this map are from selected National Map data holdings and other government sources.
Layered geospatial PDF 7.5 Minute Quadrangle Map. Layers of geospatial data include orthoimagery, roads, grids, geographic names, elevation contours, hydrography, and other selected map features. This map is derived from GIS (geospatial information system) data. It represents a repackaging of GIS data in traditional map form, not creation of new information. The geospatial data in this map are from selected National Map data holdings and other government sources.
Layered geospatial PDF 7.5 Minute Quadrangle Map. Layers of geospatial data include orthoimagery, roads, grids, geographic names, elevation contours, hydrography, and other selected map features. This map is derived from GIS (geospatial information system) data. It represents a repackaging of GIS data in traditional map form, not creation of new information. The geospatial data in this map are from selected National Map data holdings and other government sources.
This portion of the USGS data release presents eelgrass distributions derived from towed underwater video surveys of the Nisqually River delta, Washington in 2014 (USGS Field Activity Number D-01-14-PS). Eelgrass data were collected from the R/V George Davidson equipped with a towed underwater video system and global navigation satellite system (GNSS) receiver. The underwater video system consisted of a Splashcam standard definition video camera connected to a Sony GV-D1000 video monitor and tape recorder. Positioning of the survey vessel was determined at 0.5 Hz intervals using a Garmin 76c GNSS receiver. The positioning data from the GNSS were encoded onto the audio track of the digital video recording using Red...
An upward-looking acoustic Doppler velocity meter (ADVM, SonTek SW, 3.0 MHz) located in a tidal channel of the Nisqually River Delta at site D1 (N 47° 05’ 37”/W 122° 43’ 17”) measured water level and current velocity at 15-minute intervals from October 14, 2016 to May 31, 2017 (175 days, excluding missing periods). This site is in a tidal channel at a levee breach where flow is tidally influenced. The water depth of the sensor ranged from 0.44 to 4.41 m. The elevation (NAVD88) of the ADVM sensor was survey by RTN-GPS. The offset to convert all water depth time-series data to water surface elevation (NAVD88) is -0.61 m. The water temperature ranged from -0.4 to 22.7 degrees C but may have been bias during periods...
Categories: Data;
Types: Downloadable,
Map Service,
OGC WFS Layer,
OGC WMS Layer,
Shapefile;
Tags: Billy Frank Jr. Nisqually National Wildlife Refuge,
Hydrodynamics,
Sediment,
Thurston County,
salinity,
Layered geospatial PDF 7.5 Minute Quadrangle Map. Layers of geospatial data include orthoimagery, roads, grids, geographic names, elevation contours, hydrography, and other selected map features. This map is derived from GIS (geospatial information system) data. It represents a repackaging of GIS data in traditional map form, not creation of new information. The geospatial data in this map are from selected National Map data holdings and other government sources.
Layered geospatial PDF 7.5 Minute Quadrangle Map. Layers of geospatial data include orthoimagery, roads, grids, geographic names, elevation contours, hydrography, and other selected map features. This map is derived from GIS (geospatial information system) data. It represents a repackaging of GIS data in traditional map form, not creation of new information. The geospatial data in this map are from selected National Map data holdings and other government sources.
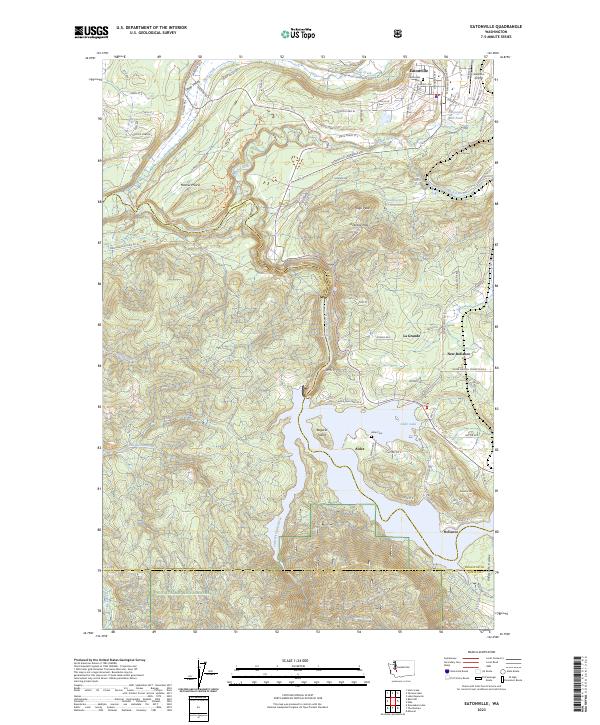
Layered geospatial PDF 7.5 Minute Quadrangle Map. Layers of geospatial data include orthoimagery, roads, grids, geographic names, elevation contours, hydrography, and other selected map features. This map is derived from GIS (geospatial information system) data. It represents a repackaging of GIS data in traditional map form, not creation of new information. The geospatial data in this map are from selected National Map data holdings and other government sources.
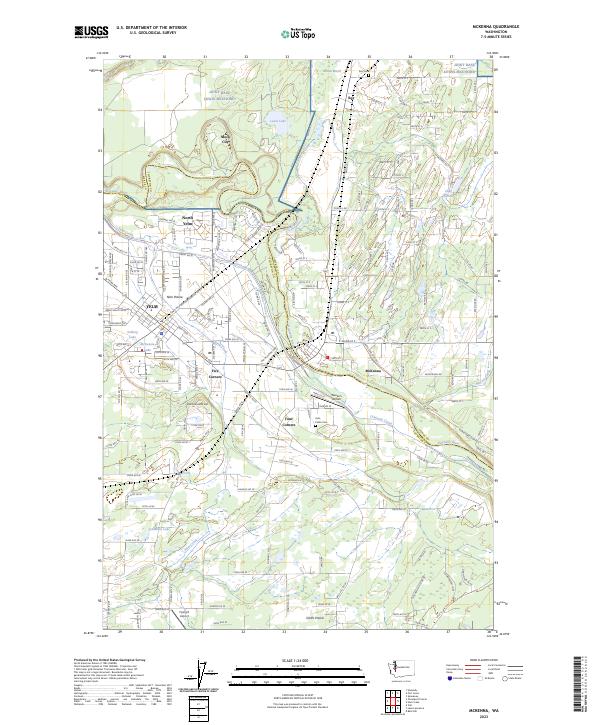
Layered geospatial PDF 7.5 Minute Quadrangle Map. Layers of geospatial data include orthoimagery, roads, grids, geographic names, elevation contours, hydrography, and other selected map features. This map is derived from GIS (geospatial information system) data. It represents a repackaging of GIS data in traditional map form, not creation of new information. The geospatial data in this map are from selected National Map data holdings and other government sources.
Layered geospatial PDF 7.5 Minute Quadrangle Map. Layers of geospatial data include orthoimagery, roads, grids, geographic names, elevation contours, hydrography, and other selected map features. This map is derived from GIS (geospatial information system) data. It represents a repackaging of GIS data in traditional map form, not creation of new information. The geospatial data in this map are from selected National Map data holdings and other government sources.
Two sensors, a vented conductivity, temperature and depth sensor (CTD) and a turbidity meter, were installed on a piling at the mouth of McAllister Creek at site MC3 (N 47° 06’ 01”/W 122° 43’ 36”) and connected to a telemetered data collection platform that was used to program, power, and log data for each sensor. Timing of the 15-minute sampling interval was synched among both sensors. The site is tidally influenced. The CTD (InSitu Aqua Troll) measured water temperature, water depth, specific conductance, and salinity from December 24, 2016 to February 17, 2017 (55 days). Water depth ranged from 0.52 to 5.49 meters. Temperature ranged from 1.1 to 9.8 degrees C. Specific conductance ranged from 5,500 to 43,100...
Categories: Data;
Types: Downloadable,
Map Service,
OGC WFS Layer,
OGC WMS Layer,
Shapefile;
Tags: Billy Frank Jr. Nisqually National Wildlife Refuge,
Hydrodynamics,
Sediment,
Thurston County,
salinity,
Discharge and suspended sediment data were collected from October 2016 to Febuary 2017 at the NR0 site. Data was collected immediately down stream of Old Pacific Hwy SE bridge during a bridge measurement and approximately 100 meters below bridge for a boat measurement. Data collection from the bridge has been ongoing since 1968 but data collection from a boat was first attempted October 21, 2016 during this data collection series. Suspended sediment sample and discrete discharge data at this site are available at: https://waterdata.usgs.gov/wa/nwis/inventory/?site_no=12090240&agency_cd=USGS&. A summary of suspended-sediment sample data are provided with this data release in the file NR0_SSC_summary.csv.
Categories: Data;
Types: Downloadable,
Map Service,
OGC WFS Layer,
OGC WMS Layer,
OGC WMS Service,
Shapefile;
Tags: Billy Frank Jr. Nisqually National Wildlife Refuge,
Hydrodynamics,
Sediment,
Thurston County,
salinity,
Multiple sensors for measuring stage (water level), water temperature, specific conductivity, turbidity and water velocity were installed at site NR2 (N 47° 04' 46.1"/W 122° 42' 30.2"), located approximately 3.1 km upstream from the mouth of the Nisqually River and within the tidal prism. The sensors were connected to a cell-phone telemetered, data collection platform (DCP) used to program and power each sensor as well as synchronize the timing of 15-minute measurement intervals. A vented conductivity, temperature and depth sensor (CTD, InSitu Aqua Troll) measured water temperature, water depth, specific conductance, and salinity from May 11, 2016 to August 3, 2016 (85 days) and from September 8, 2016 to March 16,...
Categories: Data;
Types: Downloadable,
Map Service,
OGC WFS Layer,
OGC WMS Layer,
Shapefile;
Tags: Billy Frank Jr. Nisqually National Wildlife Refuge,
Hydrodynamics,
Sediment,
Thurston County,
salinity,
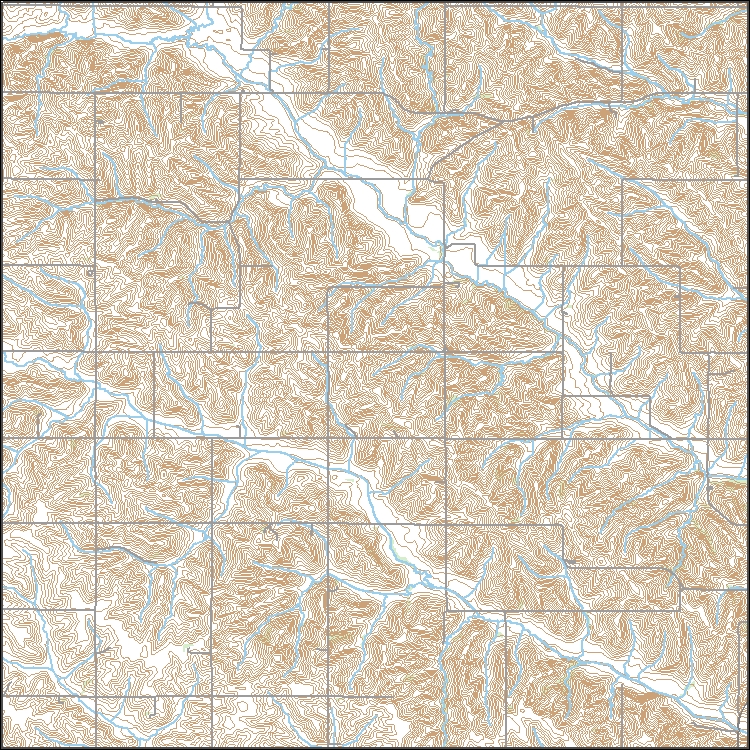
USGS Topo Map Vector Data (Vector) 34697 Pender NE, Nebraska 20210714 for 7.5 x 7.5 minute Shapefile
Layers of geospatial data include contours, boundaries, land cover, hydrography, roads, transportation, geographic names, structures, and other selected map features.
Layers of geospatial data include contours, boundaries, land cover, hydrography, roads, transportation, geographic names, structures, and other selected map features.
Layers of geospatial data include contours, boundaries, land cover, hydrography, roads, transportation, geographic names, structures, and other selected map features.
Layers of geospatial data include contours, boundaries, land cover, hydrography, roads, transportation, geographic names, structures, and other selected map features.
|

|
