Filters: Tags: Tompkins County (X)
72 results (24ms)|
Filters
Date Range
Extensions Types Contacts
Categories Tag Types
|
PROBLEM The valley‐fill aquifer in the lower Fall Creek valley (designated as aquifer 4, fig. 1), within the Towns of Dryden and Groton, was mapped by Miller (2000) and identified as one of 17 unconsolidated aquifers in Tompkins County that need to be studied in more detail. The east end of the valley (near the Tompkins and Cortland County border) is on the backside of a large morainal plug, which is part of the Valley Heads Moraine. A large system of springs discharge from the backside of the moraine and forms part of the headwaters to Fall Creek. The valley‐fill aquifer thins and pinches out to the west (figs. 1 and 2)— where the valley is floored by bedrock and becomes a “hanging valley” to Cayuga Lake trough....
Categories: Data,
Project;
Types: Downloadable,
Map Service,
OGC WFS Layer,
OGC WMS Layer,
Shapefile;
Tags: Cornell University,
Fall Creek,
Groundwater Monitoring,
Groundwater and Streamflow Information,
Groundwater-Quality Monitoring,
Background / Problem – The City of Ithaca, Tompkins County, N.Y., is in the process of developing a flood management plan for the streams that flow through the City. Flooding in the City is caused by a variety of distinct and sometimes interconnected reasons. Flooding often is a result of snowmelt and rain during the winter and spring. Slow ice-melt and breakup can lead to ice jams and subsequent flooding. Flash floods are produced by summer thunderstorms. All of these flood types are compounded by two factors: the storm-sewer system in the City and the elevation of Cayuga Lake. The storm sewers drain to the nearby streams at points below the tops of the streambanks. Because the streamward ends of the storm sewers...
Categories: Data,
Project;
Types: Downloadable,
Map Service,
OGC WFS Layer,
OGC WMS Layer,
Shapefile;
Tags: Cascadilla Creek,
Cayuga Inlet,
Cooperative Water Program,
Fall Creek,
Flood Science,
This child item dataset contains a shapefile of labels for hydrogeologic sections illustrated in Heisig, 2023 (figure 3, plate 1). The "Sec_ID" attribute lists letter-number designations for the ends of each section. Hydrogeologic section labels are in the format x - x'. By convention, the x is on the west side and the x' is on the east side of generally horizontal sections. In generally vertical sections, the x is the westernmost of the section ends and the x' is the eastermost end of the section line.
Categories: Data;
Types: Downloadable,
Map Service,
OGC WFS Layer,
OGC WMS Layer,
Shapefile;
Tags: Aquifer Mapping,
Basin & Hydrogeologic Characterization,
Cayuga County,
Freeville,
Groton,
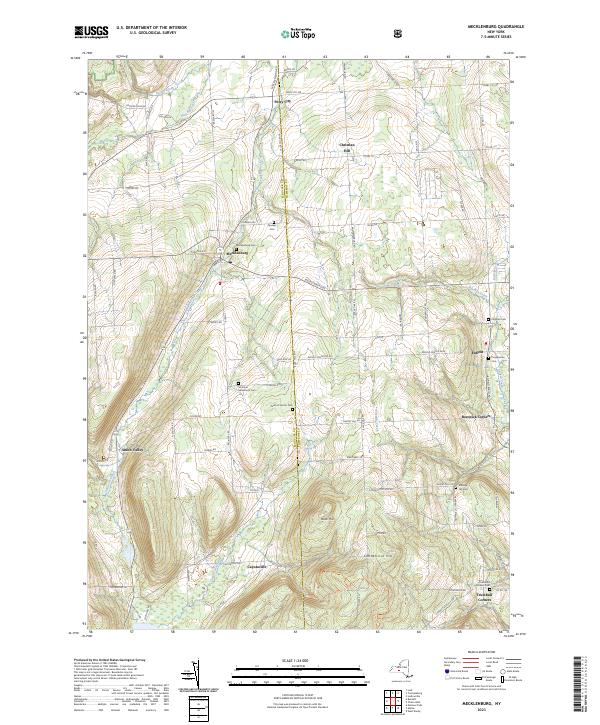
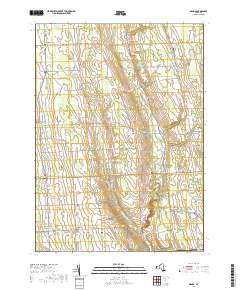
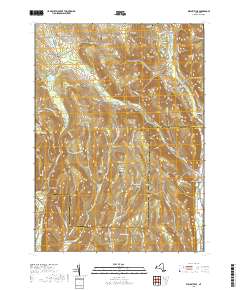
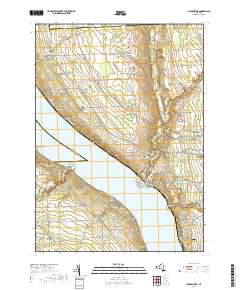
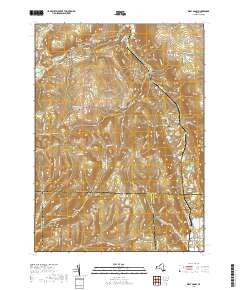
Layered geospatial PDF 7.5 Minute Quadrangle Map. Layers of geospatial data include orthoimagery, roads, grids, geographic names, elevation contours, hydrography, and other selected map features. This map is derived from GIS (geospatial information system) data. It represents a repackaging of GIS data in traditional map form, not creation of new information. The geospatial data in this map are from selected National Map data holdings and other government sources.
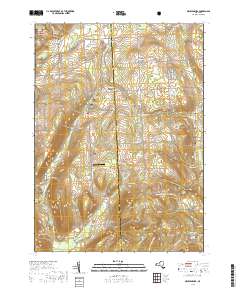
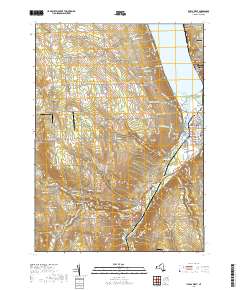
Layered geospatial PDF 7.5 Minute Quadrangle Map. Layers of geospatial data include orthoimagery, roads, grids, geographic names, elevation contours, hydrography, and other selected map features. This map is derived from GIS (geospatial information system) data. It represents a repackaging of GIS data in traditional map form, not creation of new information. The geospatial data in this map are from selected National Map data holdings and other government sources.
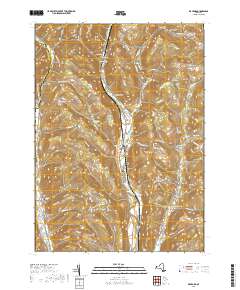
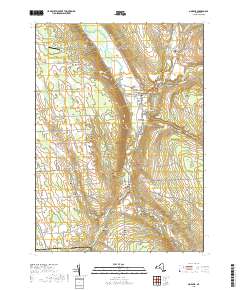
Layered geospatial PDF 7.5 Minute Quadrangle Map. Layers of geospatial data include orthoimagery, roads, grids, geographic names, elevation contours, hydrography, and other selected map features. This map is derived from GIS (geospatial information system) data. It represents a repackaging of GIS data in traditional map form, not creation of new information. The geospatial data in this map are from selected National Map data holdings and other government sources.
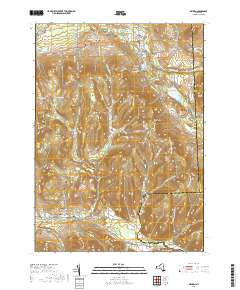
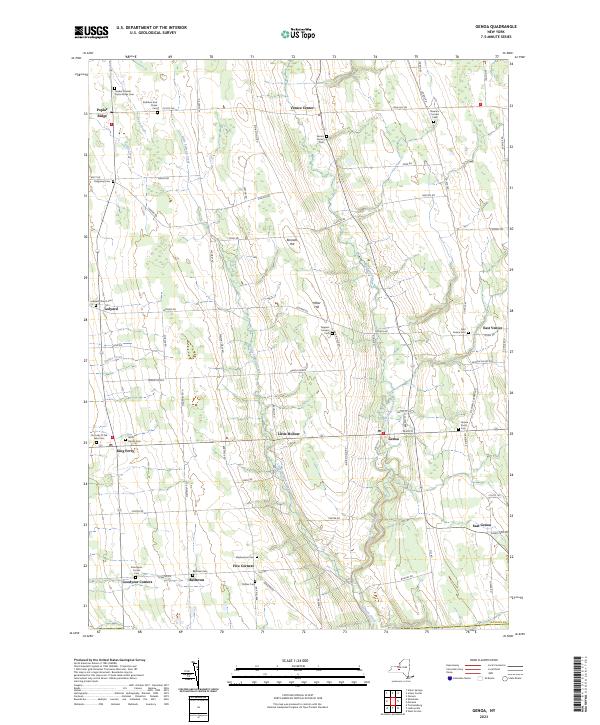
Layered geospatial PDF 7.5 Minute Quadrangle Map. Layers of geospatial data include orthoimagery, roads, grids, geographic names, elevation contours, hydrography, and other selected map features. This map is derived from GIS (geospatial information system) data. It represents a repackaging of GIS data in traditional map form, not creation of new information. The geospatial data in this map are from selected National Map data holdings and other government sources.
Layered geospatial PDF 7.5 Minute Quadrangle Map. Layers of geospatial data include orthoimagery, roads, grids, geographic names, elevation contours, hydrography, and other selected map features. This map is derived from GIS (geospatial information system) data. It represents a repackaging of GIS data in traditional map form, not creation of new information. The geospatial data in this map are from selected National Map data holdings and other government sources.
Layered geospatial PDF 7.5 Minute Quadrangle Map. Layers of geospatial data include orthoimagery, roads, grids, geographic names, elevation contours, hydrography, and other selected map features. This map is derived from GIS (geospatial information system) data. It represents a repackaging of GIS data in traditional map form, not creation of new information. The geospatial data in this map are from selected National Map data holdings and other government sources.
Layered geospatial PDF 7.5 Minute Quadrangle Map. Layers of geospatial data include orthoimagery, roads, grids, geographic names, elevation contours, hydrography, and other selected map features. This map is derived from GIS (geospatial information system) data. It represents a repackaging of GIS data in traditional map form, not creation of new information. The geospatial data in this map are from selected National Map data holdings and other government sources.
This child item dataset contains a shapefile that delineates the surficial geology of the Owasco Inlet watershed.
Categories: Data;
Types: Downloadable,
Map Service,
OGC WFS Layer,
OGC WMS Layer,
Shapefile;
Tags: Aquifer Mapping,
Basin & Hydrogeologic Characterization,
Cayuga County,
Freeville,
Groton,
This child item dataset contains a shapefile that delineates the Owasco Inlet watershed.
Categories: Data;
Types: Downloadable,
Map Service,
OGC WFS Layer,
OGC WMS Layer,
Shapefile;
Tags: Aquifer Mapping,
Basin & Hydrogeologic Characterization,
Cayuga County,
Freeville,
Groton,
This child item dataset contains a shapefile that delineates areas of known or inferred confined aquifers within the Owasco Inlet watershed.
Categories: Data;
Types: Downloadable,
Map Service,
OGC WFS Layer,
OGC WMS Layer,
Shapefile;
Tags: Aquifer Mapping,
Basin & Hydrogeologic Characterization,
Cayuga County,
Freeville,
Groton,
From April 2013 to August 2015, the U.S. Geological Survey, in cooperation with the Town of Enfield and the Tompkins County Planning Department, collected horizontal-to-vertical seismic soundings at 69 locations in the Enfield Creek valley to help determine thickness of the unconsolidated deposits and depth to bedrock. The HVSR technique, commonly referred to as the passive-seismic method, is used to estimate the thickness of unconsolidated sediments and the depth to bedrock (Lane and others, 2008). The passive-seismic method uses a single, broad-band three-component (two horizontal and one vertical) seismometer to record ambient seismic noise. In areas that have a strong acoustic contrast between the bedrock and...
This dataset contains the well records compiled for this study.
Categories: Data;
Types: Downloadable,
Map Service,
OGC WFS Layer,
OGC WMS Layer,
Shapefile;
Tags: Aquifer,
Aquifer Mapping,
Enfield,
Groundwater,
Groundwater and Streamflow Information,
In 2011, the U.S. Geological Survey, in cooperation with the Town of Newfield and the Tompkins County Planning Department, began a study of the stratified-drift aquifers in the West Branch Cayuga Inlet and Fish Kill valleys in the Town of Newfield, Tompkins County, New York. The objective of this study was to characterize the hydrogeology and water quality of the stratified-drift aquifers in the West Branch Cayuga Inlet and Fish Kill valleys and produce a summary report of the findings. The spatial extent and hydrogeologic framework of these unconsolidated aquifers were delineated using existing data, including soils maps, well records, geologic logs, topographic data, and published reports. These geospatial datasets...
Layered geospatial PDF 7.5 Minute Quadrangle Map. Layers of geospatial data include orthoimagery, roads, grids, geographic names, elevation contours, hydrography, and other selected map features. This map is derived from GIS (geospatial information system) data. It represents a repackaging of GIS data in traditional map form, not creation of new information. The geospatial data in this map are from selected National Map data holdings and other government sources.
Layered geospatial PDF 7.5 Minute Quadrangle Map. Layers of geospatial data include orthoimagery, roads, grids, geographic names, elevation contours, hydrography, and other selected map features. This map is derived from GIS (geospatial information system) data. It represents a repackaging of GIS data in traditional map form, not creation of new information. The geospatial data in this map are from selected National Map data holdings and other government sources.
Layered geospatial PDF 7.5 Minute Quadrangle Map. Layers of geospatial data include orthoimagery, roads, grids, geographic names, elevation contours, hydrography, and other selected map features. This map is derived from GIS (geospatial information system) data. It represents a repackaging of GIS data in traditional map form, not creation of new information. The geospatial data in this map are from selected National Map data holdings and other government sources.
Layered geospatial PDF 7.5 Minute Quadrangle Map. Layers of geospatial data include orthoimagery, roads, grids, geographic names, elevation contours, hydrography, and other selected map features. This map is derived from GIS (geospatial information system) data. It represents a repackaging of GIS data in traditional map form, not creation of new information. The geospatial data in this map are from selected National Map data holdings and other government sources.
|

|
