Filters: Tags: Utah (X)
14,704 results (9ms)|
Filters
Types
(Less)
|
Proportion of low and black sagebrush land cover within a 5-km radius developed using a circular focal moving window analysis.
Categories: Data;
Types: Downloadable,
GeoTIFF,
Map Service,
Raster,
Shapefile;
Tags: Artemisia arbuscula,
Artemisia nova,
Colorado,
Idaho,
Montana,
Location of mixed shrubland land cover obtained from the LANDFIRE Existing Vegetation Type dataset.
Categories: Data;
Types: Downloadable,
GeoTIFF,
Map Service,
Raster;
Tags: Colorado,
Idaho,
Montana,
United States,
Utah,
Development of oil and gas wells leads to the destruction and fragmentation of natural habitat. Oil and gas wells also increase noise levels which has been shown to be detrimental to some wildlife species. Therefore, the density of oil and gas wells in the western United States was modeled based on data obtained from the National Oil and Gas Assessment.
Categories: Data;
Types: Downloadable,
GeoTIFF,
Map Service,
Raster;
Tags: Arizona,
California,
Colorado,
Conservation Assessment,
Idaho,
This data set depicts soil characteristics in western North America. The data set was created from NRCS STATSGO soil data. Calculations were made to reduce one to many relationships to one to one relationships in order to summarize average water capacity, depth to rock, salinity, and pH for each map unit (MUID). ArcMap 8.3 was used to import .dbf files and merge newly created attribute fields to the GIS soil coverage.
Future climates are simulated by general circulation models (GCM) using climate change scenarios (IPCC 2014). To project climate change for the sagebrush biome, we used 11 GCMs and two climate change scenarios from the IPCC Fifth Assessment, representative concentration pathways (RCPs) 4.5 and 8.5 (Moss et al. 2010, Van Vuuren et al. 2011). RCP4.5 scenario represents a future where climate policies limit and achieve stabilization of greenhouse gas concentrations to 4.5 W m-2 by 2100. RCP8.5 scenario might be called a business-as-usual scenario, where high emissions of greenhouse gases continue in the absence of climate change policies. The two selected time frames allow comparison of near-term (2020-2050) and longer-term...
Categories: Data;
Types: Citation,
Downloadable,
GeoTIFF,
Map Service,
Raster;
Tags: Arizona,
CRS,
California,
Climate,
Colorado,
Field spikes were prepared at 207 stream and river sites as part of the U.S. Geological Survey (USGS) National Water Quality Assessment (NAWQA) project between December, 2012, and September, 2015. At the field site, a depth-and width-integrated environmental sample was collected, and one subsample of the environmental sample was spiked with a known amount of a spike mixture. Both the spiked subsample ("spike sample") and another subsample ("environmental sample") of the original water sample were analyzed for pesticides at the USGS National Water Quality Laboratory (NWQL) by direct injection liquid chromatography with tandem mass spectrometry (LC-MS/MS), and were used to calculate the spike recovery of each analyte....
This dataset represents ease of access to bottomland areas for vegetation treatments. Access may be by road, 4x4 near road, hike in by field crews or requiring overnight camping or raft access. Access is considered for each side of the river separately.
Categories: Data;
Types: Citation,
Downloadable,
Map Service,
OGC WFS Layer,
OGC WMS Layer,
Shapefile;
Tags: Arches National Park,
Canyonlands National Park,
Colorado River,
Grand County,
Moab,
Future climates are simulated by general circulation models (GCM) using climate change scenarios (IPCC 2014). To project climate change for the sagebrush biome, we used 11 GCMs and two climate change scenarios from the IPCC Fifth Assessment, representative concentration pathways (RCPs) 4.5 and 8.5 (Moss et al. 2010, Van Vuuren et al. 2011). RCP4.5 scenario represents a future where climate policies limit and achieve stabilization of greenhouse gas concentrations to 4.5 W m-2 by 2100. RCP8.5 scenario might be called a business-as-usual scenario, where high emissions of greenhouse gases continue in the absence of climate change policies. The two selected time frames allow comparison of near-term (2020-2050) and longer-term...
Categories: Data;
Types: Citation,
Downloadable,
GeoTIFF,
Map Service,
Raster;
Tags: Arizona,
CRS,
California,
Climate,
Colorado,
This data set shows the extent of the Colorado River Conservation Planning project bottomland area as delineated by topography and vegetation, The bottomland area is subdivided into 1 km polygons measured from the upstream project boundary. Reach breaks were determined by large topographic shifts and/or tributary junctions by John Dohrenwend. Please see the project report for more details.
Categories: Data;
Types: Downloadable,
Map Service,
OGC WFS Layer,
OGC WMS Layer,
Shapefile;
Tags: Arches National Park,
Canyonlands National Park,
Colorado River,
Grand County,
Moab,
This dataset includes the magnetotelluric (MT) sounding data collected in 2003 along a north-south profile west of Tooele, Utah. It is important to know whether major mining districts in the Northern Nevada Gold Province are underlain by rocks of the Archean Wyoming craton, which are known to contain orogenic gold deposits, or by accreted rocks of the Paleoproterozoic Mojave province. It is also important to know the location and orientation of the Archean/Proterozoic suture zone between these provinces as well as major basement structures within these terranes because they may influence subsequent patterns of sedimentation, deformation, magmatism, and hydrothermal activity. This study was funded by the U.S. Geological...
This dataset is based on U.S. Geological Survey (USGS) resource assessments for “undiscovered” natural gas liquid resources, which are resources that have not yet been extensively proven by drilling (USGS 2014). Individual resource assessments describe the amount of petroleum resources in units with similar geologic features. We quantified the density of natural gas liquid resources by adding together the amounts in spatially overlapping assessment units and dividing these totals by polygon areas. Since assessments for geologic areas used in this analysis were completed at various times, the certainty related to these values is likely to vary according to geologic unit. USGS [U.S. Geological Survey]. 2014. Energy...
Categories: Data;
Types: Downloadable,
GeoTIFF,
Map Service,
Raster;
Tags: Arizona,
Colorado,
Colorado headwaters-Plateau,
Nevada,
New Mexico,
The U.S. Geological Survey's (USGS) SPAtially Referenced Regression On Watershed attributes (SPARROW) model was used to aid in the interpretation of monitoring data and simulate streamflow and water-quality conditions in streams across the Pacific Region of the Unites States. SPARROW is a hybrid empirical/process-based mass balance model that can be used to estimate the major sources and environmental factors that affect the long-term supply, transport, and fate of contaminants in streams. The spatially explicit model structure is defined by a river reach network coupled with contributing catchments. The model is calibrated by statistically relating watershed sources and transport-related properties to monitoring-based...
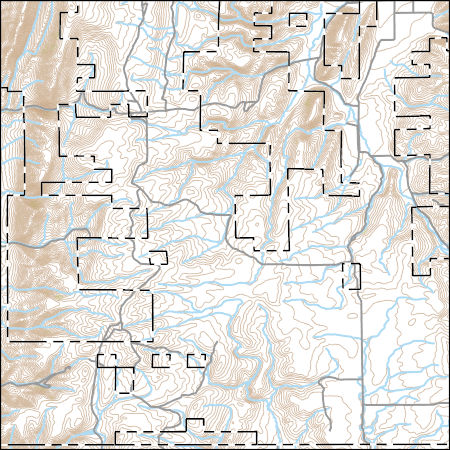
USGS Topo Map Vector Data (Vector) 34636 Pegram Creek, Idaho 20200715 for 7.5 x 7.5 minute Shapefile
Layers of geospatial data include contours, boundaries, land cover, hydrography, roads, transportation, geographic names, structures, and other selected map features.
Types: Citation;
Tags: 7.5 x 7.5 minute,
7.5 x 7.5 minute,
Bear Lake County,
Combined Vector,
Combined Vector,

This map layer consists of federally owned or administered lands of the United States, Puerto Rico, and the U.S. Virgin Islands. For the most part, only areas of 320 acres or more are included; some smaller areas deemed to be important or significant are also included. There may be private inholdings within the boundaries of Federal lands in this map layer. Some established Federal lands which are larger than 320 acres are not included in this map layer, because their boundaries were not available from the owning or administering agency.
|

|
