Filters: Tags: Valencia County (X)
132 results (102ms)|
Filters
Date Range
Types Contacts
Categories Tag Types
|
RIO GRANDE AT ISLETA, NM
RIO GRANDE AT ISLETA, NM
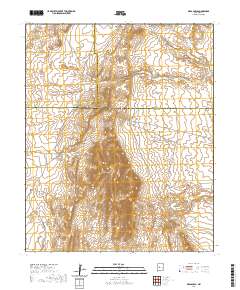
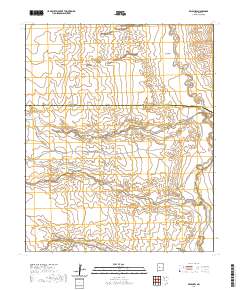
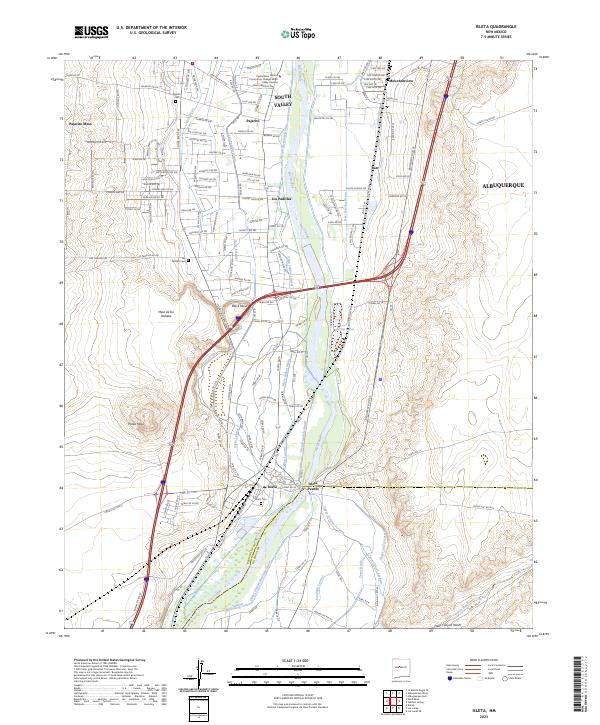
Layered geospatial PDF 7.5 Minute Quadrangle Map. Layers of geospatial data include orthoimagery, roads, grids, geographic names, elevation contours, hydrography, and other selected map features. This map is derived from GIS (geospatial information system) data. It represents a repackaging of GIS data in traditional map form, not creation of new information. The geospatial data in this map are from selected National Map data holdings and other government sources.
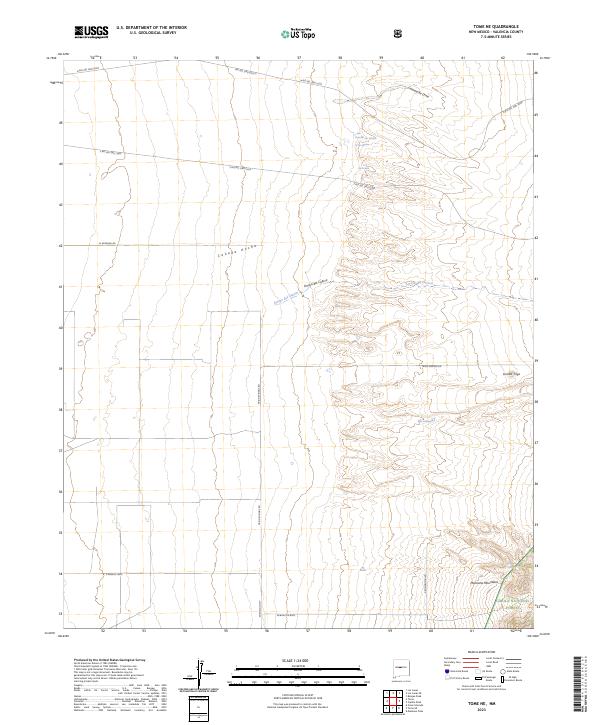
Layered geospatial PDF 7.5 Minute Quadrangle Map. Layers of geospatial data include orthoimagery, roads, grids, geographic names, elevation contours, hydrography, and other selected map features. This map is derived from GIS (geospatial information system) data. It represents a repackaging of GIS data in traditional map form, not creation of new information. The geospatial data in this map are from selected National Map data holdings and other government sources.
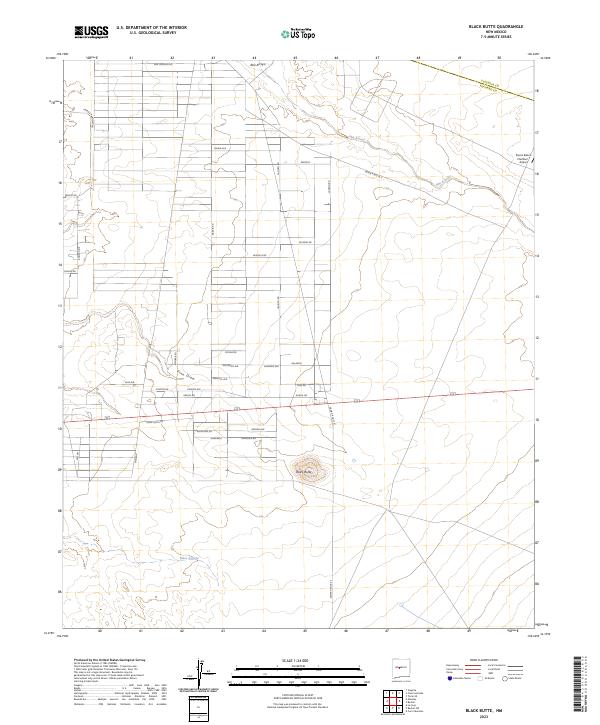
Layered geospatial PDF 7.5 Minute Quadrangle Map. Layers of geospatial data include orthoimagery, roads, grids, geographic names, elevation contours, hydrography, and other selected map features. This map is derived from GIS (geospatial information system) data. It represents a repackaging of GIS data in traditional map form, not creation of new information. The geospatial data in this map are from selected National Map data holdings and other government sources.
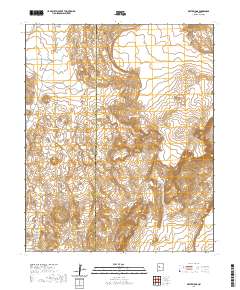
Layered geospatial PDF 7.5 Minute Quadrangle Map. Layers of geospatial data include orthoimagery, roads, grids, geographic names, elevation contours, hydrography, and other selected map features. This map is derived from GIS (geospatial information system) data. It represents a repackaging of GIS data in traditional map form, not creation of new information. The geospatial data in this map are from selected National Map data holdings and other government sources.
RIO GRANDE AT ISLETA, NM
RIO GRANDE AT ISLETA, NM
RIO GRANDE AT ISLETA, NM
The 1970s images were obtained as digital scans on CDs, with no metadata. Source information for the original aerial photographs is not available. Original photo scale was about 1:40,000 for the 1975 images (filenames beginning "r75")and 1:12,000 for the 1979 images (filenames beginning "rfl"). I registered and rectified these images using identifiable common points from 1996 DOQQs. See the description of positional accuracy below. Data derived from features mapped from the 1970s images were presented in: Friedman, J.M., Vincent, K.R., Griffin, E.R., Scott, M.L., Shafroth, P.B., and Auble, G.T., 2015, Processes of arroyo filling in northern New Mexico, USA, GSA Bulletin, 127(3/4), 621-640. doi: 10.1130/B31046.1
Layered geospatial PDF 7.5 Minute Quadrangle Map. Layers of geospatial data include orthoimagery, roads, grids, geographic names, elevation contours, hydrography, and other selected map features. This map is derived from GIS (geospatial information system) data. It represents a repackaging of GIS data in traditional map form, not creation of new information. The geospatial data in this map are from selected National Map data holdings and other government sources.
Layered geospatial PDF 7.5 Minute Quadrangle Map. Layers of geospatial data include orthoimagery, roads, grids, geographic names, elevation contours, hydrography, and other selected map features. This map is derived from GIS (geospatial information system) data. It represents a repackaging of GIS data in traditional map form, not creation of new information. The geospatial data in this map are from selected National Map data holdings and other government sources.
Layered geospatial PDF 7.5 Minute Quadrangle Map. Layers of geospatial data include orthoimagery, roads, grids, geographic names, elevation contours, hydrography, and other selected map features. This map is derived from GIS (geospatial information system) data. It represents a repackaging of GIS data in traditional map form, not creation of new information. The geospatial data in this map are from selected National Map data holdings and other government sources.
Layered geospatial PDF 7.5 Minute Quadrangle Map. Layers of geospatial data include orthoimagery, roads, grids, geographic names, elevation contours, hydrography, and other selected map features. This map is derived from GIS (geospatial information system) data. It represents a repackaging of GIS data in traditional map form, not creation of new information. The geospatial data in this map are from selected National Map data holdings and other government sources.
Layered geospatial PDF 7.5 Minute Quadrangle Map. Layers of geospatial data include orthoimagery, roads, grids, geographic names, elevation contours, hydrography, and other selected map features. This map is derived from GIS (geospatial information system) data. It represents a repackaging of GIS data in traditional map form, not creation of new information. The geospatial data in this map are from selected National Map data holdings and other government sources.
RIO GRANDE AT ISLETA, NM
RIO GRANDE AT ISLETA, NM
RIO GRANDE AT ISLETA, NM
1996 georeferenced aerial photographs cover the lower Rio Puerco from the confluence with the Rio San Jose 70 km down-valley to the confluence with the Rio Grande. The images were obtained from enlargements of 1:40,000 scale National Aerial Photography Program (NAPP) photographs printed from negatives at a scale of 1:5,000, then scanned at 600 dpi. Pixel size of the raster images is about 0.22 m, compared to the DOQQs, which have 1-m pixel size. The segments were registered and rectified in ArcINFO using common points from USGS DOQQs published in 1999, which were derived from the same 1996 NAPP photo set, with terrain corrections from a 1-degree DEM applied. Registration points were typically center of mass of small...
Layered geospatial PDF 7.5 Minute Quadrangle Map. Layers of geospatial data include orthoimagery, roads, grids, geographic names, elevation contours, hydrography, and other selected map features. This map is derived from GIS (geospatial information system) data. It represents a repackaging of GIS data in traditional map form, not creation of new information. The geospatial data in this map are from selected National Map data holdings and other government sources.
|

|
