Filters: Tags: Vancouver (X)
30 results (10ms)|
Filters
Date Range
Extensions Types Contacts
Categories Tag Types
|
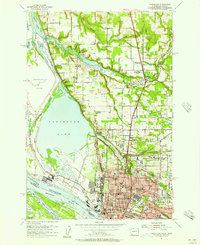
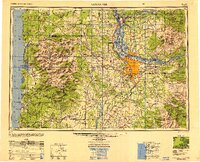
USGS Historical Quadrangle in GeoPDF.
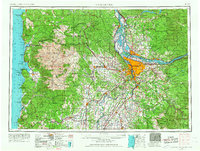
USGS Historical Quadrangle in GeoPDF.
The Sea Surface Temperature (SST) data of the nearshore region of the North Pacific show temperature ranges in degrees C using points whose locations correspond to the centroids of AVHRR Pathfinder version 5 monthly, global, 4 km data set (PFSST V50). The pathfinder rasters are available from the Physical Oceanography Distributed Active Archive Center (PO.DAAC), hosted by NASA JPL. The data points in this dataset lie within a 20 km buffer from the GSHHS (Global Self-consistent, Hierarchical, High-resolution Shoreline) coastline. The GSHHS vector data are available from the National Geophysical Data Center (NGDC). Furthermore, each point in the SST dataset is categorized by the ecoregion in which it is located. This...
The Sea Surface Temperature (SST) data of the nearshore region of the North Pacific show temperature ranges in degrees C using points whose locations correspond to the centroids of AVHRR Pathfinder version 5 monthly, global, 4 km data set (PFSST V50). The pathfinder rasters are available from the Physical Oceanography Distributed Active Archive Center (PO.DAAC), hosted by NASA JPL. The grid cells in this dataset lie within a 20 km buffer from the GSHHS (Global Self-consistent, Hierarchical, High-resolution Shoreline) coastline. The GSHHS vector data are available from the National Geophysical Data Center (NGDC). These data have been QA'd in that we have selected only data values with associated quality flags of...
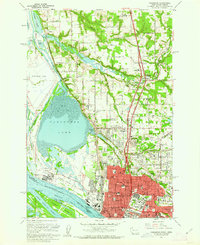
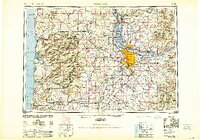
USGS Historical Quadrangle in GeoPDF.
Summary An urban energy and water balance model is presented which uses a small number of commonly measured meteorological variables and information about the surface cover. Rates of evaporation-interception for a single layer with multiple surface types (paved, buildings, coniferous trees and/or shrubs, deciduous trees and/or shrubs, irrigated grass, non-irrigated grass and water) are calculated. Below each surface type, except water, there is a single soil layer. At each time step the moisture state of each surface is calculated. Horizontal water movements at the surface and in the soil are incorporated. Particular attention is given to the surface conductance used to model evaporation and its parameters. The...
Categories: Publication;
Types: Citation;
Tags: Evaporation,
Los Angeles,
Surface conductance,
Urban energy balance,
Urban water balance,
USGS Historical Quadrangle in GeoPDF.
This data set contains imagery from the National Agriculture Imagery Program (NAIP). The NAIP program is administered by USDA FSA and has been established to support two main FSA strategic goals centered on agricultural production. These are, increase stewardship of America's natural resources while enhancing the environment, and to ensure commodities are procured and distributed effectively and efficiently to increase food security. The NAIP program supports these goals by acquiring and providing ortho imagery that has been collected during the agricultural growing season in the U.S. The NAIP ortho imagery is tailored to meet FSA requirements and is a fundamental tool used to support FSA farm and conservation programs....
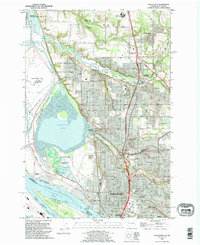
USGS Historical Quadrangle in GeoPDF.
USGS Historical Quadrangle in GeoPDF.
|

|
