Filters: Tags: Virginia (X) > partyWithName: U.S. Geological Survey (X)
7,088 results (542ms)|
Filters
Date Range
Extensions
Types
Contacts
Categories
Tag Types
|
This dataset contains photographs keyed to station points along the Blue Ridge Parkway in Virginia. Photographs are titled and arranged by 7.5-minute quadrangle, and station points are located in the "Detailed geologic mapping geodatabase for the Blue Ridge Parkway in Virginia." The first part of the photograph's filename corresponds to the FieldID attribute of the PhotoPoints entity in the Blue Ridge Parkway Geodatabase. The photographs in this collection are for the Snowden quadrangle, but are also part of a larger data release (Carter et al., 2016). For Snowden, there are 54 jpg in the collection. Carter, M.W., Crider, E.A., Southworth, C.S., and Aleinikoff, J.N., 2016, Detailed geologic mapping geodatabase for...
This dataset contains watershed means of estimated percent impervious surfaces for three time periods: 1992, 2002, and 2012. Estimates are based on coefficients derived from comparing land use of the 2012 NAWQA Wall-to-wall Anthropogenic Land-use Trends (NWALT) product to the 2011 National Land Cover Database (NLCD) imperviousness, then applying those coefficients to previous years (1974-2002) of the NWALT dataset.
Categories: Data;
Types: Citation;
Tags: Chesapeake Bay,
Delaware,
District of Columbia,
James River,
Maryland,
This data set presents attributes of floodplain ecosystem characteristics including floodplain soil denitrification, floodplain soil biogeochemistry, floodplain vegetation, floodplain sedimentation, floodplain and channel morphometry, stream discharge and water quality, floodplain climate, floodplain physiographic region, and catchment land cover. Attributes are associated with 18 floodplains of the Chesapeake Bay watershed. For many of these attributes, mean values are summaries of multiple measurements made within each floodplain site.
Categories: Data;
Tags: Maryland,
Pennsylvania,
USGS Science Data Catalog (SDC),
Virginia,
West Virginia,
Field spikes were prepared at 207 stream and river sites as part of the U.S. Geological Survey (USGS) National Water Quality Assessment (NAWQA) project between December, 2012, and September, 2015. At the field site, a depth-and width-integrated environmental sample was collected, and one subsample of the environmental sample was spiked with a known amount of a spike mixture. Both the spiked subsample ("spike sample") and another subsample ("environmental sample") of the original water sample were analyzed for pesticides at the USGS National Water Quality Laboratory (NWQL) by direct injection liquid chromatography with tandem mass spectrometry (LC-MS/MS), and were used to calculate the spike recovery of each analyte....
This dataset contains reflectance and transmission spectra of unexpanded and expanded vermiculite ore, and handpicked flakes of phlogopite, hydrobiotite, and vermiculite. These samples were collected from mines near Enoree, South Carolina; Libby, Montana; Louisa, Virginia; Palabora, Llano, Texas; and South Africa. Spectra are identified as either reflectance or transmission in the alphanumeric file names and correlate to specpr record numbers designated in the manuscript figures in which they are shown. These transmission spectra were converted to absorbance in many of the figures. Spectra of talc, fibrous richterite amphibole, and serpentine are from well characterized samples from Feiser Mine, Ruby Mountains,...

This map layer consists of federally owned or administered lands of the United States, Puerto Rico, and the U.S. Virgin Islands. For the most part, only areas of 320 acres or more are included; some smaller areas deemed to be important or significant are also included. There may be private inholdings within the boundaries of Federal lands in this map layer. Some established Federal lands which are larger than 320 acres are not included in this map layer, because their boundaries were not available from the owning or administering agency.
This shapefile contains landscape factors representing human disturbances summarized to local and network catchments of river reaches for the state of South Dakota. This dataset is the result of clipping the feature class 'NFHAP 2010 HCI Scores and Human Disturbance Data for the Conterminous United States linked to NHDPLUSV1.gdb' to the state boundary of South Dakota. Landscape factors include land uses, population density, roads, dams, mines, and point-source pollution sites. The source datasets that were compiled and attributed to catchments were identified as being: (1) meaningful for assessing fish habitat; (2) consistent across the entire study area in the way that they were assembled; (3) representative of...
Categories: Data;
Types: ArcGIS REST Map Service,
Downloadable,
Map Service,
OGC WFS Layer,
OGC WMS Layer,
Shapefile;
Tags: Anthropogenic factors,
Aquatic habitats,
Atlantic Coast FHP,
Catchment areas,
Connecticut,
This shapefile contains landscape factors representing human disturbances summarized to local and network catchments of river reaches for the state of Georgia. This dataset is the result of clipping the feature class 'NFHAP 2010 HCI Scores and Human Disturbance Data for the Conterminous United States linked to NHDPLUSV1.gdb' to the state boundary of Georgia. Landscape factors include land uses, population density, roads, dams, mines, and point-source pollution sites. The source datasets that were compiled and attributed to catchments were identified as being: (1) meaningful for assessing fish habitat; (2) consistent across the entire study area in the way that they were assembled; (3) representative of conditions...
Categories: Data;
Types: ArcGIS REST Map Service,
Downloadable,
Map Service,
OGC WFS Layer,
OGC WMS Layer,
Shapefile;
Tags: Anthropogenic factors,
Aquatic habitats,
Atlantic Coast FHP,
Catchment areas,
Connecticut,
This shapefile contains landscape factors representing human disturbances summarized to local and network catchments of river reaches for the state of Louisiana. This dataset is the result of clipping the feature class 'NFHAP 2010 HCI Scores and Human Disturbance Data for the Conterminous United States linked to NHDPLUSV1.gdb' to the state boundary of Louisiana. Landscape factors include land uses, population density, roads, dams, mines, and point-source pollution sites. The source datasets that were compiled and attributed to catchments were identified as being: (1) meaningful for assessing fish habitat; (2) consistent across the entire study area in the way that they were assembled; (3) representative of conditions...
Categories: Data;
Types: ArcGIS REST Map Service,
Downloadable,
Map Service,
OGC WFS Layer,
OGC WMS Layer,
Shapefile;
Tags: Anthropogenic factors,
Aquatic habitats,
Atlantic Coast FHP,
Catchment areas,
Connecticut,
Nitrogen, phosphorus, and suspended-sediment loads, and changes in loads, in major rivers across the Chesapeake Bay watershed have been calculated using monitoring data from the Chesapeake Bay River Input Monitoring Network (RIM) stations for the period 1985 through 2019. Nutrient and suspended-sediment loads and changes in loads were determined by applying a weighted regression approach called WRTDS (Weighted Regression on Time, Discharge, and Season). The load results represent the total mass of nitrogen, phosphorus, and suspended sediment that was exported from each of the RIM watersheds.
Categories: Data;
Types: Map Service,
OGC WFS Layer,
OGC WMS Layer,
OGC WMS Service;
Tags: Chesapeake Bay Watershed,
Delaware,
Maryland,
New York,
Pennsylvania,
This dataset contains photographs keyed to station points along the Blue Ridge Parkway in Virginia. Photographs are titled and arranged by 7.5-minute quadrangle, and station points are located in the "Detailed geologic mapping geodatabase for the Blue Ridge Parkway in Virginia." The first part of the photograph's filename corresponds to the FieldID attribute of the PhotoPoints entity in the Blue Ridge Parkway Geodatabase. The photographs in this collection are for the Willis quadrangle, but are also part of a larger data release (Carter et al., 2016). For Willis, there are 20 jpg in the collection. Carter, M.W., Crider, E.A., Southworth, C.S., and Aleinikoff, J.N., 2016, Detailed geologic mapping geodatabase for...
This shapefile contains landscape factors representing human disturbances summarized to local and network catchments of river reaches for the Desert Fish Habitat Partnership. This dataset is the result of clipping the feature class 'NFHAP 2010 HCI Scores and Human Disturbance Data for the Conterminous United States linked to NHDPLUSV1.gdb' to the boundary of the Desert Fish Habitat Partnership. Landscape factors include land uses, population density, roads, dams, mines, and point-source pollution sites. The source datasets that were compiled and attributed to catchments were identified as being: (1) meaningful for assessing fish habitat; (2) consistent across the entire study area in the way that they were assembled;...
Categories: Data;
Types: ArcGIS REST Map Service,
Downloadable,
Map Service,
OGC WFS Layer,
OGC WMS Layer,
Shapefile;
Tags: Anthropogenic factors,
Aquatic habitats,
Atlantic Coast FHP,
Catchment areas,
Connecticut,
The data document the results of several microbe bioassays performed by the USGS on Phragmites australis plants, including those performed on mature leaves, seedlings, and dead leaf tissues exploration of the literature to find accounts of microbes associated with Phragmites worldwide. For the bioassays, we prepared 162 pure cultures isolated from Phragmites plants in North America along the east coast, Florida, the Gulf of Mexico, and the Great Lakes area, 125 of which were from a previous study, and 38 represent new collections. The DNA sequences used to identify the 37 new collections are included. Microbes were isolated from plants collected from 2015-2018. We performed assays using both North American plant...
The U.S. Geological Survey (USGS) has been engaged in airborne electromagnetics (AEM) since the 1970s, playing a role in the development of early acquisition systems, developing calibration methods, refining standards for data acquisition, improving data processing, modeling, and interpretation methods, and expanding the range of AEM applications. However, USGS AEM survey visibility and data accessibility has not advanced as rapidly as our use of the technique. This data release catalogs AEM surveys in the United States that have contributed to studies under USGS programs including Water, Geologic Mapping, Minerals, Energy, Environmental Health, Ecosystems, Hazards, and Climate. This dataset contains locations for...
Categories: Data;
Types: ArcGIS REST Map Service,
ArcGIS Service Definition,
Downloadable,
Map Service;
Tags: Alabama,
Arizona,
Arkansas,
California,
Colorado,
Layered GeoPDF 7.5 Minute Quadrangle Map. Layers of geospatial data include orthoimagery, roads, grids, geographic names, elevation contours, hydrography, and other selected map features.
Layered GeoPDF 7.5 Minute Quadrangle Map. Layers of geospatial data include orthoimagery, roads, grids, geographic names, elevation contours, hydrography, and other selected map features.
Layered geospatial PDF Map. Layers of geospatial data include orthoimagery, roads, grids, geographic names, elevation contours, hydrography, and other selected map features.
Layered geospatial PDF Map. Layers of geospatial data include orthoimagery, roads, grids, geographic names, elevation contours, hydrography, and other selected map features.
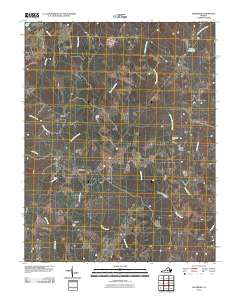
Layered GeoPDF 7.5 Minute Quadrangle Map. Layers of geospatial data include orthoimagery, roads, grids, geographic names, elevation contours, hydrography, and other selected map features.
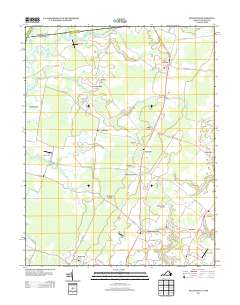
Layered GeoPDF 7.5 Minute Quadrangle Map. Layers of geospatial data include orthoimagery, roads, grids, geographic names, elevation contours, hydrography, and other selected map features.
|

|
