Filters: Tags: WAINWRIGHT (X)
24 results (86ms)|
Filters
Date Range
Extensions Types Contacts
Categories Tag Types Tag Schemes |
This data set contains imagery from the National Agriculture Imagery Program (NAIP). The NAIP program is administered by USDA FSA and has been established to support two main FSA strategic goals centered on agricultural production. These are, increase stewardship of America's natural resources while enhancing the environment, and to ensure commodities are procured and distributed effectively and efficiently to increase food security. The NAIP program supports these goals by acquiring and providing ortho imagery that has been collected during the agricultural growing season in the U.S. The NAIP ortho imagery is tailored to meet FSA requirements and is a fundamental tool used to support FSA farm and conservation programs....
This data set contains imagery from the National Agriculture Imagery Program (NAIP). The NAIP program is administered by USDA FSA and has been established to support two main FSA strategic goals centered on agricultural production. These are, increase stewardship of America's natural resources while enhancing the environment, and to ensure commodities are procured and distributed effectively and efficiently to increase food security. The NAIP program supports these goals by acquiring and providing ortho imagery that has been collected during the agricultural growing season in the U.S. The NAIP ortho imagery is tailored to meet FSA requirements and is a fundamental tool used to support FSA farm and conservation programs....
This dataset consists of short-term (~31 years) shoreline change rates for the north coast of Alaska between the Point Barrow and Icy Cape. Rate calculations were computed within a GIS using the Digital Shoreline Analysis System (DSAS) version 4.3, an ArcGIS extension developed by the U.S. Geological Survey. Short-term rates of shoreline change were calculated using a linear regression rate-of-change method based on available shoreline data between 1979 and 2010. A reference baseline was used as the originating point for the orthogonal transects cast by the DSAS software. The transects intersect each shoreline establishing measurement points, which are then used to calculate short-term rates.
Categories: Data;
Types: Citation,
Downloadable,
Map Service,
OGC WFS Layer,
OGC WMS Layer,
Shapefile;
Tags: Arctic,
Barrow,
CMGP,
Chukchi Sea,
Coastal and Marine Geology Program,
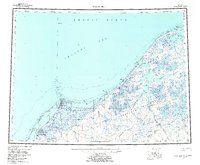
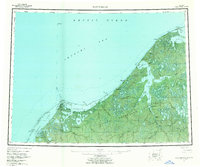
USGS Historical Quadrangle in GeoPDF.
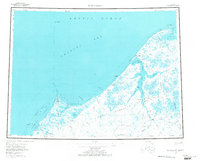
USGS Historical Quadrangle in GeoPDF.
This data set contains imagery from the National Agriculture Imagery Program (NAIP). The NAIP program is administered by USDA FSA and has been established to support two main FSA strategic goals centered on agricultural production. These are, increase stewardship of America's natural resources while enhancing the environment, and to ensure commodities are procured and distributed effectively and efficiently to increase food security. The NAIP program supports these goals by acquiring and providing ortho imagery that has been collected during the agricultural growing season in the U.S. The NAIP ortho imagery is tailored to meet FSA requirements and is a fundamental tool used to support FSA farm and conservation programs....
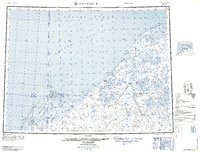
USGS Historical Quadrangle in GeoPDF.
This part of the data release presents orthoimagery spanning the ocean shoreline of Alaska from Icy Cape to Cape Prince of Wales. Aerial images were collected, and data were processed, by Fairbanks Fodar (https://www.fairbanksfodar.com) in Fairbanks, Alaska, for the U.S. Geological Survey. The aerial images, from which the orthoimages were created, were collected in 2016 between August 29 and September 4 and extend from the shoreline to 400-4000 meters inland. The aerial images were collected with precise Global Positioning System (GPS) navigation data from a manned aircraft and were then processed into orthoimages photogrammetrically and using structure-from-motion (SFM) processing methods as described in Nolan...
This dataset consists of long-term (~65 years) shoreline change rates for the north coast of Alaska between Point Barrow and Icy Cape. Rate calculations were computed within a GIS using the Digital Shoreline Analysis System (DSAS) version 4.3, an ArcGIS extension developed by the U.S. Geological Survey. Long-term rates of shoreline change were calculated using a linear regression rate-of-change method based on available shoreline data between 1947 and 2012. A reference baseline was used as the originating point for the orthogonal transects cast by the DSAS software. The transects intersect each shoreline establishing measurement points, which are then used to calculate long-term rates.
Categories: Data;
Types: Citation,
Downloadable,
Map Service,
OGC WFS Layer,
OGC WMS Layer,
Shapefile;
Tags: Arctic,
Barrow,
CMGP,
Chukchi Sea,
Coastal and Marine Geology Program,
This dataset includes shorelines from 65 years ranging from 1947 to 2012 for the north coast of Alaska between Point Barrow and Icy Cape. Shorelines were compiled from topographic survey sheets and Nautical Charts (T-sheet, Nautical Chart; National Oceanic and Atmospheric Administration (NOAA)), aerial orthophotographs (U.S. Geological Survey (USGS), National Aeronautics and Space Administration (NASA), satellite imagery (State of Alaska), and lidar elevation data (USGS). Historical shoreline positions serve as easily understood features that can be used to describe the movement of beaches through time. These data are used to calculate rates of shoreline change for the U.S. Geological Survey's National Assessment...
Categories: Data;
Types: Citation,
Downloadable,
Map Service,
OGC WFS Layer,
OGC WMS Layer,
Shapefile;
Tags: Arctic,
Barrow,
CMGP,
Chukchi Sea,
Coastal and Marine Geology Program,
This part of the data release presents a shapefile that includes a spatial index of orthoimagery and elevation data describing the Alaskan coastline from Icy Cape to Cape Prince of Wales. The data products referenced in this index include orthoimagery, digital surface models, and elevation point clouds which were generated from aerial imagery using structure-from-motion methods. Fairbanks Fodar, a contracted mapping service, collected the aerial imagery in 2016 and created all of the data products referenced here. Due to the enormous extent of this dataset, the products are split into separate files with more manageable sizes. Each polygon in this shapefile index provides a geographic outline of a data file’s coverage,...
Categories: Data;
Types: Downloadable,
Map Service,
OGC WFS Layer,
OGC WMS Layer,
Shapefile;
Tags: CMHRP,
Cape Beaufort,
Cape Espenberg,
Cape Krusenstern,
Cape Lewis,
USGS Historical Quadrangle in GeoPDF.
USGS Historical Quadrangle in GeoPDF.
USGS Historical Quadrangle in GeoPDF.
This part of the data release presents digital elevation models (DEMs) spanning the ocean shoreline of Alaska from Icy Cape to Cape Prince of Wales. Aerial images were collected, and data were processed, by Fairbanks Fodar (https://www.fairbanksfodar.com) in Fairbanks, Alaska, for the U.S. Geological Survey. The aerial images, from which the DEMs were created, were collected in 2016 between August 29 and September 4 and extend from the shoreline to 400-4000 meters inland. The aerial images were collected with precise Global Positioning System (GPS) navigation data from a manned aircraft and were then processed into DEMs photogrammetrically using structure-from-motion (SFM) processing methods as described in Nolan...
This part of the data release presents georeferenced elevation point clouds spanning the ocean shoreline of Alaska from Icy Cape to Cape Prince of Wales. Aerial images were collected, and data were processed, by Fairbanks Fodar (https://www.fairbanksfodar.com) in Fairbanks, Alaska, for the U.S. Geological Survey. The aerial images, from which the point clouds were derived, were collected in 2016 between August 29 and September 4 and extend from the shoreline to 400-4000 meters inland. The aerial images were collected with precise Global Positioning System (GPS) navigation data from a manned aircraft and were then processed using structure-from-motion (SFM) methods as described in Nolan and others, 2015 . The included...
This dataset consists of short-term (~33 years) shoreline change rates for the north coast of Alaska between Point Barrow and Icy Cape. Rate calculations were computed within a GIS using the Digital Shoreline Analysis System (DSAS) version 4.3, an ArcGIS extension developed by the U.S. Geological Survey. Short-term rates of shoreline change were calculated using an end point rate-of-change method based on available shoreline data between 1979 and 2012. A reference baseline was used as the originating point for the orthogonal transects cast by the DSAS software. Transects intersect each shoreline establishing measurement points, which are then used to calculate short-term rates.
Categories: Data;
Types: Citation,
Downloadable,
Map Service,
OGC WFS Layer,
OGC WMS Layer,
Shapefile;
Tags: Arctic,
Barrow,
CMGP,
Chukchi Sea,
Coastal and Marine Geology Program,
This dataset includes a reference baseline used by the Digital Shoreline Analysis System (DSAS) to calculate rate-of-change statistics for the sheltered north coast of Alaska coastal between Point Barrow and Icy Cape for the time period 1947 to 2012. This baseline layer serves as the starting point for all transects cast by the DSAS application and can be used to establish measurement points used to calculate shoreline-change rates.
Categories: Data;
Types: Citation,
Downloadable,
Map Service,
OGC WFS Layer,
OGC WMS Layer,
Shapefile;
Tags: Arctic,
Barrow,
Baseline,
CMGP,
Chukchi Sea,
This data set contains imagery from the National Agriculture Imagery Program (NAIP). The NAIP program is administered by USDA FSA and has been established to support two main FSA strategic goals centered on agricultural production. These are, increase stewardship of America's natural resources while enhancing the environment, and to ensure commodities are procured and distributed effectively and efficiently to increase food security. The NAIP program supports these goals by acquiring and providing ortho imagery that has been collected during the agricultural growing season in the U.S. The NAIP ortho imagery is tailored to meet FSA requirements and is a fundamental tool used to support FSA farm and conservation programs....
This dataset includes a reference baseline used by the Digital Shoreline Analysis System (DSAS) to calculate rate-of-change statistics for the exposed north coast of Alaska coastal region between Point Barrow and Icy Cape for the time period 1947 to 2012. This baseline layer serves as the starting point for all transects cast by the DSAS application and can be used to establish measurement points used to calculate shoreline-change rates.
Categories: Data;
Types: Citation,
Downloadable,
Map Service,
OGC WFS Layer,
OGC WMS Layer,
Shapefile;
Tags: Arctic,
Barrow,
Baseline,
CMGP,
Chukchi Sea,
|

|
