Filters: Tags: Wales (X)
53 results (41ms)|
Filters
Date Range
Extensions Types
Contacts
Categories Tag Types
|
This data set contains imagery from the National Agriculture Imagery Program (NAIP). The NAIP program is administered by USDA FSA and has been established to support two main FSA strategic goals centered on agricultural production. These are, increase stewardship of America's natural resources while enhancing the environment, and to ensure commodities are procured and distributed effectively and efficiently to increase food security. The NAIP program supports these goals by acquiring and providing ortho imagery that has been collected during the agricultural growing season in the U.S. The NAIP ortho imagery is tailored to meet FSA requirements and is a fundamental tool used to support FSA farm and conservation programs....
Photogrammetric digital surface models and orthoimagery for 26 coastal communities of western Alaska
The State of Alaska Division of Geological & Geophysical Surveys acquired photogrammetric digital surface models (DSMs) and co-registered orthorectified aerial images (orthoimages) for the west coast of Alaska in support of coastal vulnerability mapping efforts. This report is a summary of the data collected over 26 developed areas along approximately 3,500 km of coastline in the Bering Sea, Norton Sound, and Yukon-Kuskokwim Delta regions (fig. 1). Aerial photographs were collected between July 31 and September 6, 2015, and processed using Structure from- Motion (SfM) photogrammetry techniques. Ground control points (GCPs) and checkpoints were collected in support of these data products during a Global Navigation...
This data set contains imagery from the National Agriculture Imagery Program (NAIP). The NAIP program is administered by USDA FSA and has been established to support two main FSA strategic goals centered on agricultural production. These are, increase stewardship of America's natural resources while enhancing the environment, and to ensure commodities are procured and distributed effectively and efficiently to increase food security. The NAIP program supports these goals by acquiring and providing ortho imagery that has been collected during the agricultural growing season in the U.S. The NAIP ortho imagery is tailored to meet FSA requirements and is a fundamental tool used to support FSA farm and conservation programs....
This data set contains imagery from the National Agriculture Imagery Program (NAIP). The NAIP program is administered by USDA FSA and has been established to support two main FSA strategic goals centered on agricultural production. These are, increase stewardship of America's natural resources while enhancing the environment, and to ensure commodities are procured and distributed effectively and efficiently to increase food security. The NAIP program supports these goals by acquiring and providing ortho imagery that has been collected during the agricultural growing season in the U.S. The NAIP ortho imagery is tailored to meet FSA requirements and is a fundamental tool used to support FSA farm and conservation programs....
This data set contains imagery from the National Agriculture Imagery Program (NAIP). The NAIP program is administered by USDA FSA and has been established to support two main FSA strategic goals centered on agricultural production. These are, increase stewardship of America's natural resources while enhancing the environment, and to ensure commodities are procured and distributed effectively and efficiently to increase food security. The NAIP program supports these goals by acquiring and providing ortho imagery that has been collected during the agricultural growing season in the U.S. The NAIP ortho imagery is tailored to meet FSA requirements and is a fundamental tool used to support FSA farm and conservation programs....
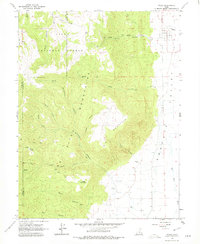
USGS Historical Quadrangle in GeoPDF.
USGS Historical Quadrangle in GeoPDF.
USGS Historical Quadrangle in GeoPDF.
This data set contains imagery from the National Agriculture Imagery Program (NAIP). The NAIP program is administered by USDA FSA and has been established to support two main FSA strategic goals centered on agricultural production. These are, increase stewardship of America's natural resources while enhancing the environment, and to ensure commodities are procured and distributed effectively and efficiently to increase food security. The NAIP program supports these goals by acquiring and providing ortho imagery that has been collected during the agricultural growing season in the U.S. The NAIP ortho imagery is tailored to meet FSA requirements and is a fundamental tool used to support FSA farm and conservation programs....
This data set contains imagery from the National Agriculture Imagery Program (NAIP). The NAIP program is administered by USDA FSA and has been established to support two main FSA strategic goals centered on agricultural production. These are, increase stewardship of America's natural resources while enhancing the environment, and to ensure commodities are procured and distributed effectively and efficiently to increase food security. The NAIP program supports these goals by acquiring and providing ortho imagery that has been collected during the agricultural growing season in the U.S. The NAIP ortho imagery is tailored to meet FSA requirements and is a fundamental tool used to support FSA farm and conservation programs....
This data set contains imagery from the National Agriculture Imagery Program (NAIP). The NAIP program is administered by USDA FSA and has been established to support two main FSA strategic goals centered on agricultural production. These are, increase stewardship of America's natural resources while enhancing the environment, and to ensure commodities are procured and distributed effectively and efficiently to increase food security. The NAIP program supports these goals by acquiring and providing ortho imagery that has been collected during the agricultural growing season in the U.S. The NAIP ortho imagery is tailored to meet FSA requirements and is a fundamental tool used to support FSA farm and conservation programs....
To inform the design and implementation of land-use policies that consider the variety of goods and services people derive from ecosystems, it is essential to understand spatial patterns of individual services, how multiple services relate to each other, and how these relationships vary across spatial scales and localities. Despite the importance of freshwater as a determinant of regional economic and human demographic patterns, there are surprisingly few studies that map the provision of a range of services associated with the quality of the aquatic environment. Here we examine relationships between indicators of riverine water and associated habitat quality, freshwater biodiversity, three terrestrial ecosystem...
This database is the result of an extensive literature search aimed at identifying documents relevant to the emerging field of dam removal science. In total the database contains 296 citations that contain empirical monitoring information associated with 207 different dam removals across the United States and abroad. Data includes publications through 2020 and supplemented with the U.S. Army Corps of Engineers National Inventory of Dams database, U.S. Geological Survey National Water Information System and aerial photos to estimate locations when coordinates were not provided. Publications were located using the Web of Science, Google Scholar, and Clearinghouse for Dam Removal Information.
Categories: Data;
Types: Map Service,
OGC WFS Layer,
OGC WMS Layer,
OGC WMS Service;
Tags: Australia,
Austria,
Canada,
Connectivity,
Dam Removal,
USGS Historical Quadrangle in GeoPDF.
USGS Historical Quadrangle in GeoPDF.
This dataset consists of short-term (less than 37 years) shoreline change rates for the exposed coast of the north coast of Alaska from Icy Cape to Cape Prince of Wales. Rate calculations were computed within a GIS using the Digital Shoreline Analysis System (DSAS) version 4.4, an ArcGIS extension developed by the U.S. Geological Survey. Rates of shoreline change were calculated using an end point rate-of-change (epr) method based on available shoreline data between 1980 and 2016. A reference baseline was used as the originating point for the orthogonal transects cast by the DSAS software. The transects intersect each shoreline establishing measurement points, which are then used to calculate shoreline change rates.
Categories: Data;
Types: Downloadable,
Map Service,
OGC WFS Layer,
OGC WMS Layer,
Shapefile;
Tags: Arctic,
Bering Land Bridge National Preserve,
CMHRP,
Cape Espenberg,
Cape Krusenstern National Monument,
This data set contains imagery from the National Agriculture Imagery Program (NAIP). The NAIP program is administered by USDA FSA and has been established to support two main FSA strategic goals centered on agricultural production. These are, increase stewardship of America's natural resources while enhancing the environment, and to ensure commodities are procured and distributed effectively and efficiently to increase food security. The NAIP program supports these goals by acquiring and providing ortho imagery that has been collected during the agricultural growing season in the U.S. The NAIP ortho imagery is tailored to meet FSA requirements and is a fundamental tool used to support FSA farm and conservation programs....
This dataset consists of long-term (less than 68 years) shoreline change rates for the sheltered north coast of Alaska from Icy Cape to Cape Prince of Wales. Rate calculations were computed within a GIS using the Digital Shoreline Analysis System (DSAS) version 4.4, an ArcGIS extension developed by the U.S. Geological Survey. Rates of shoreline change were calculated using a linear regression rate-of-change (lrr) method based on available shoreline data between 1948 and 2016. A reference baseline was used as the originating point for the orthogonal transects cast by the DSAS software. The transects intersect each shoreline establishing measurement points, which are then used to calculate rates of change.
Categories: Data;
Types: Downloadable,
Map Service,
OGC WFS Layer,
OGC WMS Layer,
Shapefile;
Tags: Arctic,
Bering Land Bridge National Preserve,
CMHRP,
Cape Espenberg,
Cape Krusenstern National Monument,
This dataset consists of long-term (less than 68 years) shoreline change rates for the exposed coast of the north coast of Alaska from Icy Cape to Cape Prince of Wales. Rate calculations were computed within a GIS using the Digital Shoreline Analysis System (DSAS) version 4.4, an ArcGIS extension developed by the U.S. Geological Survey. Rates of shoreline change were calculated using a linear regression rate-of-change (lrr) method based on available shoreline data between 1948 and 2016. A reference baseline was used as the originating point for the orthogonal transects cast by the DSAS software. The transects intersect each shoreline establishing measurement points, which are then used to calculate shoreline change...
Categories: Data;
Types: Downloadable,
Map Service,
OGC WFS Layer,
OGC WMS Layer,
Shapefile;
Tags: Arctic,
Bering Land Bridge National Preserve,
CMHRP,
Cape Espenberg,
Cape Krusenstern National Monument,
This data set contains imagery from the National Agriculture Imagery Program (NAIP). The NAIP program is administered by USDA FSA and has been established to support two main FSA strategic goals centered on agricultural production. These are, increase stewardship of America's natural resources while enhancing the environment, and to ensure commodities are procured and distributed effectively and efficiently to increase food security. The NAIP program supports these goals by acquiring and providing ortho imagery that has been collected during the agricultural growing season in the U.S. The NAIP ortho imagery is tailored to meet FSA requirements and is a fundamental tool used to support FSA farm and conservation programs....
|

|
