Filters: Tags: Wildlife Habitat (X)
93 results (13ms)|
Filters
Date Range
Extensions Types Contacts
Categories Tag Types Tag Schemes
|
The use of biomass crops as an energy source is frequently mentioned as an option to reduce CO 2 emissions. To evaluate the possibilities reliable yield estimates of biomass crops are required. In this paper a simple method is developed to estimate regional yields of various biomass crops, based on the linear relation between intercepted light and biomass production. The quality of the estimates was studied by using the method to estimate yields of several agricultural crops in two regions in The Netherlands. In general a deviation of less than 10 % was found between actual and estimated average yield.
Categories: Publication;
Types: Citation;
Tags: Aesthetics,
focus groups,
herbicides,
public perceptions,
right-of-way,
The cumulative effects problem in natural resource management and land use planning stems from the difficulty of demonstrating that while each single land use change results in a negligible impact, the accumulation of these individual changes over time and within a landscape or region may constitute a major impact. This paper details a general approach to estimate the cumulative effects of land use change on wildlife habitat using Summit County, CO, USA as a case study. Our approach is based on a functional relationship between effect on habitat and distance from development. Within this building-effect distance, habitat is assumed to be degraded, producing a disturbance zone. We sum the total area within the disturbance...

Future (2046-2065) predicted probability of fisher year-round occurrence projected under the A1fi emissions scenario with the Hadley CM3 GCM model (Gordon et al. 2000, Pope et al. 2000). Projected fisher distribution was created with Maxent (Phillips et al. 2006) using fisher detections (N = 102, spanning 1993 – 2011) and seven predictor variables: mean winter (January – March) precipitation, mean summer (July – September) precipitation, mean summer temperature amplitude, mean daily low temperature for the month of the year with the warmest mean daily low temperature, mean fraction of vegetation carbon burned, mean vegetation carbon (g C m2), and modal vegetation class. Predictor variables had a grid cell size of...
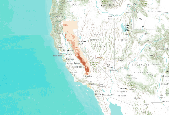
Description: Predicted probability of fisher year-round occurrence created with Maxent (Phillips et al. 2006) using fisher detections (N = 102, spanning 1993 – 2011) and seven predictor variables: mean winter (January – March) precipitation, mean summer (July – September) precipitation, mean summer temperature amplitude, mean daily low temperature for the month of the year with the warmest mean daily low temperature, mean fraction of vegetation carbon burned, mean vegetation carbon (g C m2), and modal vegetation class. Predictor variables had a grid cell size of 10 km, vegetation variables were simulated with MC1 (Hayhoe et al. 2004) and climate variables were provided by the PRISM GROUP (Daly et al. 1994). This...

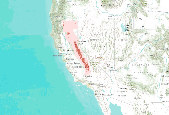
Predicted probability of marten year-round occurrence derived from future (2076-2095) climate projections and vegetation simulations. Projected marten distribution was created with Maxent (Phillips et al. 2006) using marten detections (N = 102, spanning 1993 – 2011) and eight predictor variables: mean potential evapotranspiration, mean annual precipitation, mean fraction of vegetation carbon burned, mean forest carbon (g C m2), mean fraction of vegetation carbon in forest, understory index (fraction of grass vegetation carbon in forest), average maximum tree LAI, and modal vegetation class. Future climate drivers were generated using statistical downscaling (simple delta method) of general circulation model projections,...
The PFLCC has recently completed a set of comprehensive conservation planning scenarios for the state of Florida. This represents the first statewide effort to assess likely alternative futures for conservation considering an array of financial, biological, climatological and urbanistic conditions. These spatially explicit and temporal scenarios simulate both urban growth and climate change and identify the most suitable areas for conservation given the resulting land use pattern. Conservation allocations are based on both fee-title and conservation easements.The conservation priorities and mechanisms expressed in these scenarios are based on a wide set of contributing factors, and simulated conservation is purposefully...
Categories: Data;
Types: Map Service,
OGC WFS Layer,
OGC WMS Layer,
OGC WMS Service;
Tags: 2014,
Conservation Planning,
Data,
Datasets/Database,
Impact Assessment,
The PFLCC has recently completed a set of comprehensive conservation planning scenarios for the state of Florida. This represents the first statewide effort to assess likely alternative futures for conservation considering an array of financial, biological, climatological and urbanistic conditions. These spatially explicit and temporal scenarios simulate both urban growth and climate change and identify the most suitable areas for conservation given the resulting land use pattern. Conservation allocations are based on both fee-title and conservation easements.The conservation priorities and mechanisms expressed in these scenarios are based on a wide set of contributing factors, and simulated conservation is purposefully...
Categories: Data;
Types: Map Service,
OGC WFS Layer,
OGC WMS Layer,
OGC WMS Service;
Tags: 2014,
Conservation Planning,
Datasets/Database,
Impact Assessment,
LCC,
For more information about how these data were developed, please see the final report. Expert opinion was used to define a resistance surface for each of the target animals, with higher resistance representing map units expected to be more difficult and more dangerous for species to move through. A set of nodes for each species, with node points indicating center locations for potential source populations for the species, are also defined. Note actual species population data to define the nodes is not used, as that data was often unavailable, and the focus is on the potential spread of the species across the SALCC region and not limited to models to known populations. Therefore, node locations were determined by...
Categories: Data;
Types: ArcGIS REST Map Service,
ArcGIS Service Definition,
Downloadable,
Map Service;
Tags: Southeast,
black bear,
connectivity,
corridors,
future projection,
Past climate changes have led to considerable changes in the species composition of ecosystems. The recent increase in average global temperature is rather strong compared to previous warming periods and, if climate models are correct, future warming will be even stronger. Especially in Europe where the landscape has been greatly fragmented by human activities, the ongoing and projected changes in climate will pose an additional stress on the natural biodiversity. This paper will discuss a method for the selection of bio-indicators to assess the possible landscape-ecological effects of climate change, and presents some preliminary results of the selection of indicator species for the Netherlands.
Categories: Publication;
Types: Citation;
Tags: Aesthetics,
focus groups,
herbicides,
public perceptions,
right-of-way,

Predicted probability of fisher year-round occurrence created with Maxent (Phillips et al. 2006) using fisher detections (N = 302, spanning 1990 – 2011) and five predictor variables: mean annual precipitation, mean summer (July – September) precipitation, mean understory index (fraction of grass vegetation carbon in forest), mean forest carbon (g C m2), and mean fraction of vegetation carbon in forest. Predictor variables had a grid cell size of 800 m by 800 m, vegetation variables were simulated with MC1 dynamic global vegetation model (Bachelet et al. 2001) and historical climate variables were provided by the PRISM GROUP (Daly et al. 2008). This fisher distribution model has a 10-fold cross-validated AUC of...
Future (2076-2095) predicted probability of marten year-round occurrence projected under the A2 emissions scenario with the PCM1 GCM (Washington et al. 2000; Meehl et al. 2003). The projected marten distribution was created with Maxent (Phillips et al. 2006) using marten detections (N = 302, spanning 1990 – 2011) and nine predictor variables: mean annual precipitation, mean summer (July – September) precipitation, mean summer temperature amplitude, mean annual temperature maximum, mean fraction of vegetation carbon burned, mean understory index, mean vegetation carbon (g C m2), modal vegetation class, and average maximum tree LAI. Predictor variables had a grid cell size of 10 km, vegetation variables were simulated...
The PFLCC has recently completed a set of comprehensive conservation planning scenarios for the state of Florida. This represents the first statewide effort to assess likely alternative futures for conservation considering an array of financial, biological, climatological and urbanistic conditions. These spatially explicit and temporal scenarios simulate both urban growth and climate change and identify the most suitable areas for conservation given the resulting land use pattern. Conservation allocations are based on both fee-title and conservation easements.The conservation priorities and mechanisms expressed in these scenarios are based on a wide set of contributing factors, and simulated conservation is purposefully...
Categories: Data;
Types: Map Service,
OGC WFS Layer,
OGC WMS Layer,
OGC WMS Service;
Tags: 2014,
Conservation Planning,
Datasets/Database,
Impact Assessment,
LCC,
The connectivity result files from Circuitscape represent the "adjusted cumulative current density" flowing across the landscape for each of several species, at a 90-meter resolution across the South Atlantic Landscape Conservation Cooperative region. Rasters are classified using quantiles with 20 categories (each 5% of region) to integer scores from 1-20. 1 = lowest 5% of the landscape, 20= top 5% of landscape Expert opinion was used to define a resistance surface for each of the target animals, with higher resistance representing map units expected to be more difficult and dangerous for species to move through. A set of nodes for each species, with node points indicating center locations for potential source populations,...
Categories: Data;
Types: ArcGIS REST Map Service,
ArcGIS Service Definition,
Downloadable,
Map Service;
Tags: Eastern cougar,
Southeast,
connectivity,
corridors,
future projection,

Predicted probability of fisher winter occurrence created with Maxent (Phillips et al. 2006) using fisher detections (N = 33, December – April, spanning 1995 – 2011) and eight predictor variables: mean winter (January – March) precipitation, mean winter (January – March) minimum temperature, mean fraction of vegetation carbon burned, mean understory index (fraction of grass vegetation carbon in forest), mean fraction of total forest carbon in coarse wood carbon, mean forest carbon (g C m2), mean fraction of vegetation carbon in forest, and modal vegetation class. Predictor variables had a grid cell size of 4 km by 4 km, vegetation variables were simulated by the MC1 dynamic global vegetation model (Bachelet et al....

Predicted probability of marten year-round occurrence derived from future (2076-2095) climate projections and vegetation simulations. Projected marten distribution was created with Maxent (Phillips et al. 2006) using marten detections (N = 302, spanning 1990 – 2011) and nine predictor variables: mean winter (January – March) precipitation, mean amount of snow on the ground in March, mean understory index (fraction of grass vegetation carbon in forest), mean fraction of total forest carbon in coarse wood carbon, average maximum tree LAI, mean fraction of vegetation carbon burned, mean forest carbon (g C m2), mean fraction of vegetation carbon in forest, and modal vegetation class. Future climate drivers were...
Climate change results in an alteration of spatial and temporal patterns of climate hazards. The trend in weather related disaster seems upward. Various socio-economic sectors are affected by these changes, e.g. the disaster reduction institutions and the insurance industry. We report about an ongoing project addressing the vulnerabilities of sectors affected and policy options in various sectors, notably "Storms over NW-Europe", "the insurance sector" (both as a sector impacted by change and as a mechanism to cope with risk) and "cyclones in the South Pacific".
Categories: Publication;
Types: Citation;
Tags: Aesthetics,
focus groups,
herbicides,
public perceptions,
right-of-way,

Predicted probability of marten year-round occurrence derived from future (2046-2065) climate projections and vegetation simulations. Projected marten distribution was created with Maxent (Phillips et al. 2006) using marten detections (N = 302, spanning 1990 – 2011) and nine predictor variables: mean winter (January – March) precipitation, mean amount of snow on the ground in March, mean understory index (fraction of grass vegetation carbon in forest), mean fraction of total forest carbon in coarse wood carbon, average maximum tree LAI, mean fraction of vegetation carbon burned, mean forest carbon (g C m2), mean fraction of vegetation carbon in forest, and modal vegetation class. Future climate drivers were...
Biome-wide sagebrush core habitat and growth areas estimated from a threat-based conservation design
These data were compiled as a part of a landscape conservation design effort for the sagebrush biome, and are the result of applying a spatially explicit model that assessed geographic patterns in sagebrush ecological integrity and used these results to identify Core Sagebrush Areas (CSAs), Growth Opportunity Areas (GOAs), and Other Rangeland Areas (ORAs). Our overall objective in this study was to characterize geographic patterns in ecological integrity of sagebrush ecosystems. These data represent the estimated integrity of sagebrush ecosystems, estimated from a spatial model that assigns high integrity is areas with abundant big sagebrush and perennial grass/forb cover and with minimal annual grass/forb cover,...
File-based data for download: https://www.sciencebase.gov/catalog/item/632a1290d34e71c6d67b9061Related report with figures: https://doi.org/10.3133/ofr20221081Location and extent of the human modification threat across the sagebrush biome in the United States for 2020. Blue areas (dark and light,representing core sagebrush areas [CSAs] and growth opportunity areas [GOAs], respectively) are locations of high sagebrush ecological integrityand could serve as anchor points in an overall biome-wide strategy. A separate, high-resolution portable document format (PDF) version of this mapis available at https://doi.org/10.3133/ofr20221081 so that stakeholders can zoom in and see the results at much smaller scales. By zooming...
|

|
