Filters: Tags: Will County (X)
155 results (88ms)|
Filters
Date Range
Extensions Types Contacts
Categories Tag Types Tag Schemes |
Layers of geospatial data include contours, boundaries, land cover, hydrography, roads, transportation, geographic names, structures, and other selected map features.
Types: Citation;
Tags: 7.5 x 7.5 minute,
7.5 x 7.5 minute,
Combined Vector,
Combined Vector,
Combined Vector,
Layers of geospatial data include contours, boundaries, land cover, hydrography, roads, transportation, geographic names, structures, and other selected map features.
Types: Citation;
Tags: 7.5 x 7.5 minute,
7.5 x 7.5 minute,
Combined Vector,
Combined Vector,
Combined Vector,
Layers of geospatial data include contours, boundaries, land cover, hydrography, roads, transportation, geographic names, structures, and other selected map features.
Types: Citation;
Tags: 7.5 x 7.5 minute,
7.5 x 7.5 minute,
Combined Vector,
Combined Vector,
Combined Vector,
Layers of geospatial data include contours, boundaries, land cover, hydrography, roads, transportation, geographic names, structures, and other selected map features.
Types: Citation;
Tags: 7.5 x 7.5 minute,
7.5 x 7.5 minute,
Combined Vector,
Combined Vector,
Combined Vector,
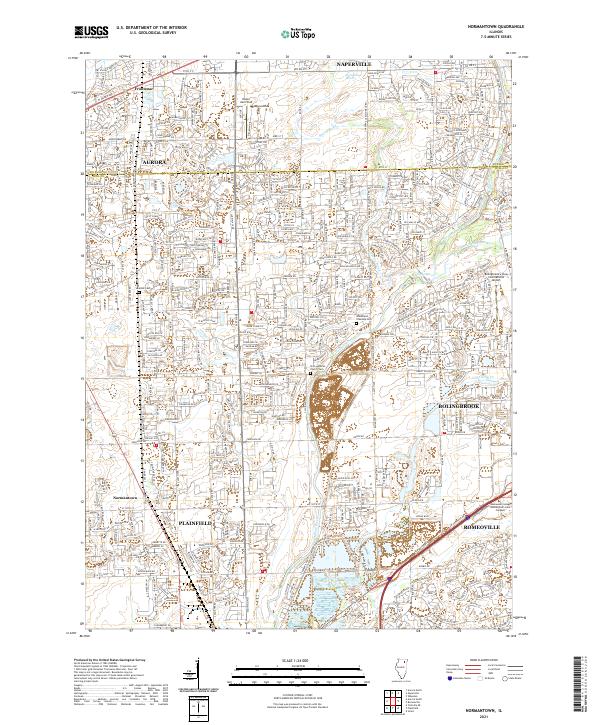
Layered geospatial PDF 7.5 Minute Quadrangle Map. Layers of geospatial data include orthoimagery, roads, grids, geographic names, elevation contours, hydrography, and other selected map features. This map is derived from GIS (geospatial information system) data. It represents a repackaging of GIS data in traditional map form, not creation of new information. The geospatial data in this map are from selected National Map data holdings and other government sources.
Layered geospatial PDF 7.5 Minute Quadrangle Map. Layers of geospatial data include orthoimagery, roads, grids, geographic names, elevation contours, hydrography, and other selected map features. This map is derived from GIS (geospatial information system) data. It represents a repackaging of GIS data in traditional map form, not creation of new information. The geospatial data in this map are from selected National Map data holdings and other government sources.
Layered geospatial PDF 7.5 Minute Quadrangle Map. Layers of geospatial data include orthoimagery, roads, grids, geographic names, elevation contours, hydrography, and other selected map features. This map is derived from GIS (geospatial information system) data. It represents a repackaging of GIS data in traditional map form, not creation of new information. The geospatial data in this map are from selected National Map data holdings and other government sources.
Layered geospatial PDF 7.5 Minute Quadrangle Map. Layers of geospatial data include orthoimagery, roads, grids, geographic names, elevation contours, hydrography, and other selected map features. This map is derived from GIS (geospatial information system) data. It represents a repackaging of GIS data in traditional map form, not creation of new information. The geospatial data in this map are from selected National Map data holdings and other government sources.
Layered geospatial PDF 7.5 Minute Quadrangle Map. Layers of geospatial data include orthoimagery, roads, grids, geographic names, elevation contours, hydrography, and other selected map features. This map is derived from GIS (geospatial information system) data. It represents a repackaging of GIS data in traditional map form, not creation of new information. The geospatial data in this map are from selected National Map data holdings and other government sources.
Layers of geospatial data include contours, boundaries, land cover, hydrography, roads, transportation, geographic names, structures, and other selected map features.
Types: Citation;
Tags: 7.5 x 7.5 minute,
7_5_Min,
Combined Vector,
Combined Vector,
Combined Vector,
The data collection for the concrete-walled channel downstream from the Brandon Road Lock and Dam near Joliet, Illinois occurred in May 2014 Five pounds per square inch (lb/in2) was used as a threshold water pressure value for this study as this value incorporates fish behavior and structural integrity considerations. The Brandon Road study evaluated the performance of two different water gun configurations within the concrete-walled channel downstream from the lock with depths ranging from 12-15 feet. Data from a single 80 cubic inch (in³) water gun produced a roughly cylindrical 5 lb/in2 pressure field 20 feet in radius, oriented vertically, with the radius decreasing to less than 15 feet at the surface. A combination...
Categories: Data;
Types: Citation;
Tags: Asian Carp,
Brandon Road Lock and Dam,
Illinois,
Illinois River,
Invasive Species,
In August 2015, water velocities around a fully-loaded commercial barge tow were measured as the barge tow traveled upstream through the Chicago Sanitary and Ship Canal from a starting position in Lockport Pool, and passed through the Electric Dispersal Barrier System at river mile (RM) 296 near Romeoville, IL. Velocity measurements were made in and alongside the gap formed by the junction between the boxed stern of a rake hopper barge and the raked bow of a rake tanker barge (herein referred to as the rake-to-box junction gap) using two SonTek Argonaut SW 3kHz acoustic Doppler velocity meters (ADVM). One ADVM was mounted 0.091 meters below the water surface, facing downward in the center of the rake-to-box junction...
Categories: Data;
Types: Citation;
Tags: Chicago Sanitary and Ship Canal,
Illinois,
Lockport Locks,
Romeoville,
USGS Science Data Catalog (SDC),
In 2016, the U.S. Fish and Wildlife Service, U.S. Geological Survey, and U.S. Army Corps of Engineers undertook a large-scale interagency field study to determine the influence of commercial barge vessels on the efficacy of the Electric Dispersal Barrier System (EDBS) in the Chicago Sanitary and Ship Canal (CSSC) in preventing fish passage. This study included a series of trials in which a tow, consisting of a tug vessel and six fully-loaded barges, transited the EDBS in both upstream-bound (n = 23) and downstream-bound (n = 22) directions. A 600 kHz Teledyne RDI Channel Master Acoustic Doppler Velocity Meter (ADVM), was mounted on the west canal wall at a depth of approximately 5.5 feet (1.7 meters), as measured...
Layers of geospatial data include contours, boundaries, land cover, hydrography, roads, transportation, geographic names, structures, and other selected map features.
Types: Citation;
Tags: 7.5 x 7.5 minute,
7.5 x 7.5 minute,
Combined Vector,
Combined Vector,
Combined Vector,
Layers of geospatial data include contours, boundaries, land cover, hydrography, roads, transportation, geographic names, structures, and other selected map features.
Types: Citation;
Tags: 7.5 x 7.5 minute,
7.5 x 7.5 minute,
Combined Vector,
Combined Vector,
Combined Vector,
These vector contour lines are derived from the 3D Elevation Program using automated and semi-automated processes. They were created to support 1:24,000-scale CONUS and Hawaii, 1:25,000-scale Alaska, and 1:20,000-scale Puerto Rico / US Virgin Island topographic map products, but are also published in this GIS vector format. Contour intervals are assigned by 7.5-minute quadrangle, so this vector dataset is not visually seamless across quadrangle boundaries. The vector lines have elevation attributes (in feet above mean sea level on NAVD88), but this dataset does not carry line symbols or annotation.
Layered geospatial PDF 7.5 Minute Quadrangle Map. Layers of geospatial data include orthoimagery, roads, grids, geographic names, elevation contours, hydrography, and other selected map features. This map is derived from GIS (geospatial information system) data. It represents a repackaging of GIS data in traditional map form, not creation of new information. The geospatial data in this map are from selected National Map data holdings and other government sources.
Layered geospatial PDF 7.5 Minute Quadrangle Map. Layers of geospatial data include orthoimagery, roads, grids, geographic names, elevation contours, hydrography, and other selected map features. This map is derived from GIS (geospatial information system) data. It represents a repackaging of GIS data in traditional map form, not creation of new information. The geospatial data in this map are from selected National Map data holdings and other government sources.
Water velocities were measured in the Calumet Harbor for 5 dates in 2015 and 2016 using Teledyne Rio Grande 600 kHz acoustic Doppler current profilers (ADCP). The data were georeferenced with differential Dlobal Positioning System (GPS) receivers with submeter accuracy. These velocity data were collected in cooperation with the US Army Corps of Engineers, Chicago District. ADCP data were collected on the following dates and for the following purposes: May 12, 2015: Water velocities in the Calumet Harbor and Calumet River. Unsteady discharges in the Calumet River mouth. September 9, 2015: Water velocities in the Calumet Harbor and Calumet River mouth. October 5, 2015: Water velocities in the Calumet Harbor and Calumet...
Types: Citation,
Map Service,
OGC WFS Layer,
OGC WMS Layer,
OGC WMS Service;
Tags: Calumet Harbor,
Calumet River,
Des Plaines River,
Illinois,
Lake Calumet,
These data were collected using a 600 kHz TRDI Rio Grande acoustic Doppler current profiler (ADCP) in mode 12 with 50 centimeter bins from a moving boat. The data were georeferenced with a Trimble Ag132 differential Global Positioning System (GPS) receiver with submeter accuracy. The data have been depth-averaged over the entire measured portion of the water column and temporally averaged over 5-second intervals to reduce noise. These data were collected during water-quality surveys of the right bank of the Chicago Sanitary and Ship Canal (CSSC) and include low-velocity regions of the canal such as barge slips in addition to the main channel. Data were processed using the Velocity Mapping Toolbox (Parsons and others,...
Categories: Data;
Types: Citation,
Map Service,
OGC WFS Layer,
OGC WMS Layer,
OGC WMS Service;
Tags: Chicago Sanitary and Ship Canal,
Cook County,
DuPage County,
Illinois,
Velocity,
|

|
