Filters: Tags: area burned (X)
18 results (8ms)|
Filters
Date Range
Extensions Types Contacts
Categories Tag Types Tag Schemes |

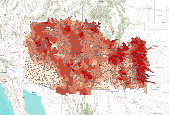
Percent change in the mean area burned per year (per ~4 km pixel ) for each HUC5 watershed between historical (1971-2000) and future (2071-2100) time periods. The MC1 dynamic vegetation model was run under the CSIRO, MIROC, and Hadley climate change projections and the A2 anthropogenic emissions scenario.Mean area burned per year per ~4 km pixel, (in square meters), was determined for each HUC5 watershed. Watersheds represent 5th level (HUC5, 10-digit) hydrologic unit boundaries and were acquired from the Natural Resources Conservation Service. Background: The dynamic global vegetation model MC1 (see Bachelet et al. 2001) was used to simulate vegetation dynamics, associated carbon and nitrogen cycle, water budget,...
Percent change in the mean area burned per year (per ~4 km pixel) for each HUC5 watershed between historical (1971-2000) and future (2071-2100) time periods. The MC1 dynamic vegetation model was run under the CSIRO, MIROC, and Hadley climate change projections and the A2 anthropogenic emissions scenario. Mean area burned per year per ~4 km pixel (in square meters), was determined for each HUC5 watershed. Watersheds represent 5th level (HUC5, 10-digit) hydrologic unit boundaries and were acquired from the Natural Resources Conservation Service. Background: The dynamic global vegetation model MC1 (see Bachelet et al. 2001) was used to simulate vegetation dynamics, associated carbon and nitrogen cycle, water...

For his MS thesis, Brendan Rogers used the vegetation model MC1 to simulate vegetation dynamics, associated carbon and nitrogen cycle, water budget and wild fire impacts across the western 2/3 of the states of Oregon and Washington using climate input data from the PRISM group (Chris Daly, OSU) at a 30arc second (800m) spatial grain. The model was run from 1895 to 2100 assuming that nitrogen demand from the plants was always met so that the nitrogen concentrations in various plant parts never dropped below their minimum reported values. A CO2 enhancement effect increased productivity and water use efficiency as the atmospheric CO2 concentration increased. Future climate change scenarios were generated through statistical...
This dataset represents the historical mean annual area burned per ~ 4 km pixel, averaged for each HUC5 watershed, simulated by the model MC1 for the 30-year period 1971-2000. Historical mean area burned per year (in square meters) per ~4 km pixel was averaged across each HUC5 watershed. Watersheds represent 5th level (HUC5, 10-digit) hydrologic unit boundaries and were acquired from the Natural Resources Conservation Service. Background: The dynamic global vegetation model MC1 (see Bachelet et al.2001) was used to simulate vegetation dynamics, associated carbon and nitrogen cycle, water budget, and wild fire impacts for OR, WA, AZ and NM, for a project funded by the USDA Forest Service (PNW09-JV-11261900-003)....

This dataset represents the historical mean annual area burned per ~ 4 km pixel, averaged for each HUC5 watershed, simulated by the model MC1 for the 30-year period 1971-2000. Historical mean area burned per year (in square meters) per ~4 km pixel was averaged across each HUC5 watershed. Watersheds represent 5th level (HUC5, 10-digit) hydrologic unit boundaries and were acquired from the Natural Resources Conservation Service. Background: The dynamic global vegetation model MC1 (see Bachelet et al.2001) was used to simulate vegetation dynamics, associated carbon and nitrogen cycle, water budget, and wild fire impacts for OR, WA, AZ and NM, for a project funded by the USDA Forest Service (PNW09-JV-11261900-003)....
***This data set is superseded by Welty, J.L., and Jeffries, M.I., 2020, Combined wildfire datasets for the United States and certain territories, 1878-2019: U.S. Geological Survey data release, https://doi.org/10.5066/P9Z2VVRT.*** The increase in wildfires, particularly in the western U.S., represents one of the greatest threats to multiple native ecosystems. Despite this threat, there is currently no central repository to store both past and current wildfire perimeter data. Currently, wildfire boundaries can only be found in disparate local or national datasets. These datasets are generally restricted to specific locations, fire sizes, or time periods. Our first objective was to create a comprehensive national...
For his MS thesis, Brendan Rogers used the vegetation model MC1 to simulate vegetation dynamics, associated carbon and nitrogen cycle, water budget and wild fire impacts across the western 2/3 of the states of Oregon and Washington using climate input data from the PRISM group (Chris Daly, OSU) at a 30arc second (800m) spatial grain. The model was run from 1895 to 2100 assuming that nitrogen demand from the plants was always met so that the nitrogen concentrations in various plant parts never dropped below their minimum reported values. A CO2 enhancement effect increased productivity and water use efficiency as the atmospheric CO2 concentration increased. Future climate change scenarios were generated through statistical...

This dataset contains acres burned by month and grid cell on 1X1 degree lat long grid. Each monthly figure is the total area for fires reported to start during the month. So, a fire that started in July 31 and burned for a month will be reported in July, not August.Data have undergone several minor revisions since this publication, and were updated through 2004 in April 2005. There will probably be no further revisions or updates. I will be concentrating on a western North American large fire database containing wildfires greater than 200 ha west of 100 W Lat. The enclosed data sets were exported from a 3-dimensional R data matrix to ascii on April 18, 2004.
Tags: Area Burned,
Western United States

For his MS thesis, Brendan Rogers used the vegetation model MC1 to simulate vegetation dynamics, associated carbon and nitrogen cycle, water budget and wild fire impacts across the western 2/3 of the states of Oregon and Washington using climate input data from the PRISM group (Chris Daly, OSU) at a 30arc second (800m) spatial grain. The model was run from 1895 to 2100 assuming that nitrogen demand from the plants was always met so that the nitrogen concentrations in various plant parts never dropped below their minimum reported values. A CO2 enhancement effect increased productivity and water use efficiency as the atmospheric CO2 concentration increased. Future climate change scenarios were generated through statistical...

For his MS thesis, Brendan Rogers used the vegetation model MC1 to simulate vegetation dynamics, associated carbon and nitrogen cycle, water budget and wild fire impacts across the western 2/3 of the states of Oregon and Washington using climate input data from the PRISM group (Chris Daly, OSU) at a 30arc second (800m) spatial grain. The model was run from 1895 to 2100 assuming that nitrogen demand from the plants was always met so that the nitrogen concentrations in various plant parts never dropped below their minimum reported values. A CO2 enhancement effect increased productivity and water use efficiency as the atmospheric CO2 concentration increased. Future climate change scenarios were generated through statistical...
This map shows the projected area burned in the YKL region for the current, near-term, and long-term decades, using the Alaska Frame-Based Ecosystem Model (ALFRESCO). These data are provided by Bureau of Land Management (BLM) "as is" and may contain errors or omissions. The User assumes the entire risk associated with its use of these data and bears all responsibility in determining whether these data are fit for the User's intended use. These data may not have the accuracy, resolution, completeness, timeliness, or other characteristics appropriate for applications that potential users of the data may contemplate. The User is encouraged to carefully consider the content of the metadata file associated with these...
Types: Live Data;
Tags: Alaska Frame-Based Ecosystem Model (ALFRESCO),
BLM,
Bureau of Land Management,
DOI,
Fire,

For his MS thesis, Brendan Rogers used the vegetation model MC1 to simulate vegetation dynamics, associated carbon and nitrogen cycle, water budget and wild fire impacts across the western 2/3 of the states of Oregon and Washington using climate input data from the PRISM group (Chris Daly, OSU) at a 30arc second (800m) spatial grain. The model was run from 1895 to 2100 assuming that nitrogen demand from the plants was always met so that the nitrogen concentrations in various plant parts never dropped below their minimum reported values. A CO2 enhancement effect increased productivity and water use efficiency as the atmospheric CO2 concentration increased. Future climate change scenarios were generated through statistical...
For his MS thesis, Brendan Rogers used the vegetation model MC1 to simulate vegetation dynamics, associated carbon and nitrogen cycle, water budget and wild fire impacts across the western 2/3 of the states of Oregon and Washington using climate input data from the PRISM group (Chris Daly, OSU) at a 30arc second (800m) spatial grain. The model was run from 1895 to 2100 assuming that nitrogen demand from the plants was always met so that the nitrogen concentrations in various plant parts never dropped below their minimum reported values. A CO2 enhancement effect increased productivity and water use efficiency as the atmospheric CO2 concentration increased. Future climate change scenarios were generated through statistical...
For his MS thesis, Brendan Rogers used the vegetation model MC1 to simulate vegetation dynamics, associated carbon and nitrogen cycle, water budget and wild fire impacts across the western 2/3 of the states of Oregon and Washington using climate input data from the PRISM group (Chris Daly, OSU) at a 30arc second (800m) spatial grain. The model was run from 1895 to 2100 assuming that nitrogen demand from the plants was always met so that the nitrogen concentrations in various plant parts never dropped below their minimum reported values. A CO2 enhancement effect increased productivity and water use efficiency as the atmospheric CO2 concentration increased. Future climate change scenarios were generated through statistical...
For his MS thesis, Brendan Rogers used the vegetation model MC1 to simulate vegetation dynamics, associated carbon and nitrogen cycle, water budget and wild fire impacts across the western 2/3 of the states of Oregon and Washington using climate input data from the PRISM group (Chris Daly, OSU) at a 30arc second (800m) spatial grain. The model was run from 1895 to 2100 assuming that nitrogen demand from the plants was always met so that the nitrogen concentrations in various plant parts never dropped below their minimum reported values. A CO2 enhancement effect increased productivity and water use efficiency as the atmospheric CO2 concentration increased. Future climate change scenarios were generated through statistical...
Wildland fire is a global phenomenon, and a result of interactions between climate?weather, fuels and people. Our climate is changing rapidly primarily through the release of greenhouse gases that may have profound and possibly unexpected impacts on global fire activity. The present paper reviews the current understanding of what the future may bring with respect to wildland fire and discusses future options for research and management. To date, research suggests a general increase in area burned and fire occurrence but there is a lot of spatial variability, with some areas of no change or even decreases in area burned and occurrence. Fire seasons are lengthening for temperate and boreal regions and this trend should...
Categories: Publication;
Types: Citation,
Journal Citation;
Tags: International Journal of Wildland Fire,
area burned,
carbon,
emissions,
fire activity,

Percent change in the mean area burned per year (per ~4 km pixel) for each HUC5 watershed between historical (1971-2000) and future (2071-2100) time periods. The MC1 dynamic vegetation model was run under the CSIRO, MIROC, and Hadley climate change projections and the A2 anthropogenic emissions scenario.Mean area burned per year per ~4 km pixel (in square meters), was determined for each HUC5 watershed. Watersheds represent 5th level (HUC5, 10-digit) hydrologic unit boundaries and were acquired from the Natural Resources Conservation Service. Background: The dynamic global vegetation model MC1 (see Bachelet et al. 2001) was used to simulate vegetation dynamics, associated carbon and nitrogen cycle, water budget,...
This dataset represents the historical mean annual area burned per ~ 4 km pixel, averaged for each HUC5 watershed, simulated by the model MC1 for the 30-year period 1971-2000. Historical mean area burned per year (in square meters) per ~4 km pixel was averaged across each HUC5 watershed. Watersheds represent 5th level (HUC5, 10-digit) hydrologic unit boundaries and were acquired from the Natural Resources Conservation Service. Background: The dynamic global vegetation model MC1 (see Bachelet et al.2001) was used to simulate vegetation dynamics, associated carbon and nitrogen cycle, water budget, and wild fire impacts for OR, WA, AZ and NM, for a project funded by the USDA Forest Service (PNW09-JV-11261900-003)....
|

|
