Filters: Tags: biodiversity (X)
466 results (12ms)|
Filters
Date Range
Extensions Types Contacts
Categories Tag Types Tag Schemes |
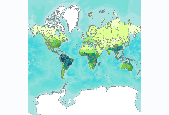
Number of amphibian species, by freshwater ecoregion. We calculated the number of amphibian species per freshwater ecoregion using species range maps of the Global Amphibian Assessment (GAA, www.iucnredlist.org/amphibians) (IUCN et al. 2006). The 2006 GAA assessed 5,918 amphibian species and provided distribution maps for 5,640 of those species. When a range overlapped several ecoregions, we counted species as present in all those ecoregions that had part of the range. This may have resulted in an overestimate of species numbers in some ecoregions, especially those that are long and narrow in shape. This is particularly true for the Amazonas High Andes ecoregion (312), where the mountain range has been used as...
The development of water resources to satisfy urban water needs has had serious impacts on freshwater ecosystem integrity and on valuable ecosystem services, but positive trends are emerging that point the way toward a solution. We demonstrate this through case studies of water resource development in and around five large urban areas: Los Angeles, Phoenix, New York, San Antonio, and Atlanta. Providing freshwater ecosystems with the water flows necessary to sustain their health, while meeting the other challenges of urban water management, will require greatly increased water productivity in conjunction with improvements in the degree to which planning and management take ecosystem needs into account. There is great...
Categories: Publication;
Types: Citation,
Journal Citation;
Tags: American Institute of Biological Sciences,
BioScience,
biodiversity,
freshwater ecosystems,
hydrologic alteration,

This assessment presents GIS data containing results of all freshwater assessment analyses conducted by The Nature Conservancy for Washington State. This data set includes values for biodiversity metrics (e.g. suitability, threat, number of species) across all HUC6 watersheds in Washington State, as well as identifies rivers, watersheds, and wetlands that provide the best opportunities for conservation of Washington's native freshwater species and ecological systems. Fore more information, visit waconservation.org .

Gridded fields of changes in discharge due to historical deforestation and conversion to agriculture from Douglas et al. (2005). This historical scenario compared discharge (Q) generated from pre-industrial land cover with discharge derived from contemporary landcover. Change in Q = difference between river discharge (Q) generated from pre-industrial land cover (based on WWF Terrestrial Ecoregions of the World (Olson et al., 2001) with river discharge derived from contemporary landcover. Historical and contemporary Q was estimated from flow routed RO generated by the UNH Water Systems Analysis Group Water Balance Model (WBM) at a 30' (lat x long) spatial resolution (Fekete et al. 2002). Citations in dataset history.
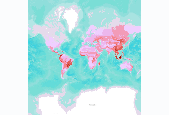
Number of globally threatened animals, by terrestrial ecoregion. We compiled a vertebrate species list for each ecoregion from WWF’s WildFinder database (WWF 2006). This list was then compared against the IUCN Red List of Threatened Species (2008) to determine the number of species per ecoregion that are threatened. Threatened species are those listed by IUCN Red List as Vulnerable, Endangered, or Critically Endangered (www.redlist.org). These data were derived by The Nature Conservancy, and were displayed in a map published in The Atlas of Global Conservation (Hoekstra et al., University of California Press, 2010). More information at http://nature.org/atlas. Data derived from: World Wildlife Fund (WWF). 2006....
GAP distribution models represent the areas where species are predicted to occur based on habitat associations. GAP distribution models are the spatial arrangement of environments suitable for occupation by a species. In other words, a species distribution is created using a deductive model to predict areas suitable for occupation within a species range. To represent these suitable environments, GAP compiled existing GAP data, where available, and compiled additional data where needed. Existing data sources were the Southwest Regional Gap Analysis Project (SWReGAP) and the Southeast Gap Analysis Project (SEGAP) as well as a data compiled by Sanborn Solutions and Mason, Bruce and Girard. Habitat associations were...
Categories: Data;
Types: ArcGIS REST Map Service,
Map Service;
Tags: Biodiversity,
Conservation,
GAP,
Gap Analysis,
Species Distribution,

Number of mammal species, by terrestrial ecoregion. We compiled data on terrestrial mammals by querying the WWF WildFinder database for species occurrences by ecoregion. The WWF WildFinder database is a spatially explicit online database of vertebrate species occurrences by ecoregion. These data were displayed in a map published in The Atlas of Global Conservation (Hoekstra et al., University of California Press, 2010). More information at http://nature.org/atlas.
Land management practices often directly alter vegetation structure and composition, but the degree to which ecological processes such as herbivory interact with management to influence biodiversity is less well understood. We hypothesized that intensive forest management and large herbivores have compounding effects on early-seral plant communities and plantation establishment (i.e., tree survival and growth), and the degree of such effects is dependent on the intensity of management practices. We established 225 m2 wild ungulate (deer and elk) exclosures nested within a manipulated gradient of management intensity (no-spray Control, Light herbicide, Moderate herbicide and Intensive herbicide treatments), replicated...
Categories: Data;
Types: Citation;
Tags: Lincoln County, Oregon,
Oregon,
Oregon Coast Range,
Pacific Northwest,
Polk County, Oregon,
These data were generated for a cooperative project created by an agreement between the Federal Lands and Highways, Central Federal Lands Division (FLH-CFL) and the USGS Fort Collins Science Center (Colorado; https://www.fort.usgs.gov/) to facilitate development of spatially explicit natural resources and socioeconomic information for utilization during comprehensive transportation planning efforts. Federal Lands Highways (FLH) is the federal agency that helps guide and support transportation planning at national, regional, and state levels, including providing funding, information, and tools to state transportation planners. FLH is currently undertaking a series of pilot studies aimed at improving the availability,...
The data set consists of data collected in 1995, 1996, and 1997 in wetlands in the Prairie Pothole Region of North Dakota and South Dakota. The data were summarized and used in the analysis for two publications in peer-reviewed journals. The data consists of one data set that includes bird abundance and richness data, wetland class (temporary, seasonal, semipermanent, permanent, alkali), and wetland type (private or federal). In conjunction with surveys of wetland birds, the following wetland variables also were recorded: wetland size, date, local-level habitat variables (percent coverage of open water, emergent vegetation, wet meadow, and shoreline/mudflat), and landscape-level habitat variables (percent cover...
Categories: Data;
Tags: Aquatic Biology,
Aquatic birds,
Arrowwood Wetland Management District,
Audubon Wetland Management District,
Biodiversity,
This paper evaluates the economic and environmental impacts of three alternative landscape scenarios created by a team of landscape architects, following input from an interdisciplinary team of researchers. In the first scenario, the main objective was to increase production and profitability of commercial agriculture with environmental objectives given secondary weight. In the second scenario, water quality improvements were the main objective with secondary objectives being financial health of the agricultural sector and maintenance and restoration of biodiversity. In the third scenario, maintenance and restoration of native biodiversity was the main objective with secondary weight given to the financial health...
Categories: Publication;
Types: Citation;
Tags: Biodiversity,
Data Visualization & Tools,
Environmental quality,
Farm profit,
Landscape design,
This map shows all the places conservation elements. Some of the places included exhibit high biodiversity or ecological and cultural value. This map also shows other managed areas from the Protected Areas Database, as well as those that are excluded. Associated input datasets are also included; they relate to biodiversity, special areas, and development. These data are provided by Bureau of Land Management (BLM) "as is" and may contain errors or omissions. The User assumes the entire risk associated with its use of these data and bears all responsibility in determining whether these data are fit for the User's intended use. These data may not have the accuracy, resolution, completeness, timeliness, or other characteristics...
Aspect is the compass direction toward which a slope faces, measured in degrees from North in a clockwise direction from 0 to 360. Aspect was generated using ArcGIS Spatial Analyst, with the USGS National Elevation Dataset as input. For quality information regarding the National Elevation Dataset, see http://nationalmap.gov/elevation.html. These data cover the entire continental U.S. and are a continuous data layer. These raster data have a 30 m x 30 m cell resolution. This aspect data set is considered official foundational data for the GAP species modeling process. The data have been made available provisionally to enhance understanding and use of GAP species data.
Types: Citation,
Map Service,
OGC WFS Layer,
OGC WMS Layer,
OGC WMS Service;
Tags: Aspect,
Biodiversity,
Conservation,
Topography,
United States
If conservation of biodiversity is the goal, then the protected areas network of the continental US may be one of our best conservation tools for safeguarding ecological systems (i.e., vegetation communities). We evaluated representation of ecological systems in the current protected areas network and found insufficient representation at three vegetation community levels within lower elevations and moderate to high productivity soils. We used national-level data for ecological systems and a protected areas database to explore alternative ways we might be able to increase representation of ecological systems within the continental US. By following one or more of these alternatives it may be possible to increase the...
Categories: Publication;
Types: Citation;
Tags: Biodiversity,
Conservation of Natural Resources,
Ecosystem,
Environment,
Geography,
The Species Richness Maps included here are based on the Gap Analysis Project (GAP) habitat maps, which are predictions of the spatial distribution of suitable environmental and land cover conditions within the United States for individual species. Individual species habitat distribution models were summed to create the total richness for each vertebrate taxa. The summing process was coded in Python 2.7 and employed the arcpy module for geoprocessing steps. The code is documented in the log file which is included in the Sciencebase item along with the richness data for each taxa (See processing steps for file names and sciencebase urls). Mapped habitat distribution areas represent places where the environment is...
Categories: Data;
Types: ArcGIS REST Map Service,
Map Service;
Tags: United States,
biodiversity,
biota,
conservation,
gap analysis,
The Hawaii Forest Bird Survey (HFBS) systematically characterized plant and bird communities across transects spanning all major Hawaiian Islands except O‘ahu. This extensive dataset has now been organized into a database and associated geographic information system (GIS) layers. This baseline provides an opportunity to assess how forest ecosystems and their constituent bird and plant populations have changed over time. As part of the HaBiTATS (Hawaiian Biodiversity Trends Across Time and Space) project, a select area on Hawai‘i Island was surveyed in 2015 with the objective of demonstrating the potential of using the HFBS methodology to reassess the status of bird and plant communities across multiple geographic...
The Hawaii Forest Bird Survey (HFBS) systematically characterized plant and bird communities across transects spanning all major Hawaiian Islands except O‘ahu. This extensive dataset has now been organized into a database and associated geographic information system (GIS) layers. This baseline provides an opportunity to assess how forest ecosystems and their constituent bird and plant populations have changed over time. As part of the HaBiTATS (Hawaiian Biodiversity Trends Across Time and Space) project, a select area on Hawai‘i Island was surveyed in 2015 with the objective of demonstrating the potential of using the HFBS methodology to reassess the status of bird and plant communities across multiple geographic...
This EnviroAtlas web service supports research and online mapping activities related to EnviroAtlas (https://www.epa.gov/enviroatlas). The Clean and Plentiful Water category in this web service includes layers illustrating the ecosystems and natural resources that filter and regulate water, the need or demand for clean and plentiful water, the impacts associated with water quality, and factors that place stress on water quality and supply. EnviroAtlas allows the user to interact with a web-based, easy-to-use, mapping application to view and analyze multiple ecosystem services for the conterminous United States. Additional descriptive information about each attribute in this web service is located within each web...
Grasslands comprise a small part of the Chihuahuan Desert but are vital to the biological diversity of the ecoregion. Characteristic grasses of the Chihuahuan Desert are tobosa (Pleuraphis mutica) and black grama (Bouteloua eriopoda) but other common species include alakali sacaton (Sporobolus airoides), big alkali sacaton (S. wrightii), mesa dropseed (S. flexuosus), blue grama (B. gracilis), sideoats grama (B. curtipendula ), hairy grama (B. hirsuta), slender grama (B. filiformis), chino grama (B. brevista), spruce top grama (B. chondrosioides), bush muhly (Muhlenbergia porteri), several three awns (Aristida spp.), and fluff grass (Dasyochloa pulchela) (Johnson 1974, Dinerstein et al. 2000). Many of the sites discussed...
Categories: Publication;
Types: Citation,
Map Service,
OGC WFS Layer,
OGC WMS Layer,
OGC WMS Service;
Tags: English,
Madrean,
Spanish,
agriculture,
assessment,
|

|
