Filters: Tags: caribbean (X)
57 results (99ms)|
Filters
Date Range
Extensions Types Contacts
Categories Tag Types
|
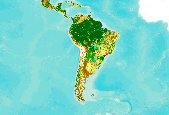
This dataset is an extract from the GlobCover 2009 land cover map, covering Central and South America. The GlobCover 2009 land cover map is derived by an automatic and regionally-tuned classification of a time series of global MERIS (MEdium Resolution Imaging Spectrometer) FR mosaics for the year 2009. The global land cover map counts 22 land cover classes defined with the United Nations (UN) Land Cover Classification System (LCCS). For more information on the GlobCover project, see http://ionia1.esrin.esa.int/ Note on display: class 210: Water Bodies is set to "transparent" to improve display in the Data Basin map. Within the extract's extent, no data were removed from the original dataset.
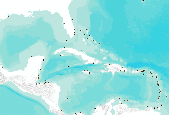
Cruise ship ports in the Caribbean and intensity of visitation. This dataset was created on 24th April 2003 and represents all cruise ports in the Wider Caribbean and the number of calls by cruise ships that are scheduled between 1st May 2003 and 1st may 2004. Cruise ships alter their ports of call from year to year and there are other destinations that have not been included in this dataset, as no ships are scheduled.

This dataset represents the name and location of dive centres in the Caribbean as points.
This composite shaded relief image dataset depicts generalized bathymetry and topography of the Caribbean region.
The Caribbean region is part of World Energy Assessment region 6 (Central and South America). A fundamental task in the assessment is to map the locations and type of production for existing oil and gas fields. The Petroconsultants database is the only available database that has coverage for the Caribbean region. Oil and gas field symbols represent field center-points and are published with permission from Petroconsultants International Data Corporation, 2002 database.
Categories: Data,
pre-SM502.8;
Types: Downloadable,
Map Service,
OGC WFS Layer,
OGC WMS Layer,
Shapefile;
Tags: AG,
AI,
AN,
AW,
Anguilla,
This dataset contains topographic (horizontal and vertical) data for 20 sites, surveyed November 6 to November 28, 2017 as part of documentation of flooding that occurred in Puerto Rico during and after Hurricane Maria (September to November 2017). Hurricane Maria hit the Island of Puerto Rico on September 20, 2017 and was one of the deadliest storms in U.S. history. USGS personnel conducted topographic surveys at selected stream sites to facilitate hydraulic modeling of peak streamflows (or discharges) – termed indirect measurements – using published standard USGS methods. Indirect (post-flood) measurements are used to characterize flood peaks that could not be determined using direct methods (for example current-velocity...
Categories: Data;
Tags: Caribbean,
Eastern Caribbean,
Elevation,
GPS measurement,
Global Positioning System (GPS) observations,
The U.S. Geological Survey (USGS) maintains shoreline positions for the United States coasts from both older sources, such as aerial photos or topographic surveys, as well as contemporary sources like lidar point clouds and digital elevation models (DEMs). These shorelines are compiled and analyzed in the Digital Shoreline Analysis System (DSAS) software to compute rates of change. It is useful to keep a record of historical shoreline positions as a method of monitoring change over time to identify areas most susceptible to erosion or accretion. These data can help coastal managers understand which areas of the coast are vulnerable to change. This data release and other associated products represent an expansion...
Categories: Data;
Types: Downloadable,
Map Service,
OGC WFS Layer,
OGC WMS Layer,
Shapefile;
Tags: Aerial Photos,
Atlantic Coast,
Caribbean,
Coastal and Marine Geology Program,
Culebra,
The U.S. Geological Survey (USGS) maintains shoreline positions for the United States coasts from both older sources, such as aerial photographs or topographic surveys, and contemporary sources, such as lidar-point clouds and digital elevation models. These shorelines are compiled and analyzed in the Digital Shoreline Analysis System software to compute their rates of change. Keeping a record of historical shoreline positions is an effective method to monitor change over time, enabling scientists to identify areas most susceptible to erosion or accretion. These data can help coastal managers understand which areas of the coast are vulnerable to change. This data release, and other associated products, represent...
Categories: Data;
Types: Downloadable,
Map Service,
OGC WFS Layer,
OGC WMS Layer,
Shapefile;
Tags: Atlantic Coast,
Caribbean,
Coastal and Marine Geology Program,
Culebra,
DSAS,
This inventory was originally created by Harp and others (2016) describing the landslides triggered by the M 7.0 Haiti earthquake that occurred on 12 January 2010 at 21:53:10 UTC. Care should be taken when comparing with other inventories because different authors use different mapping techniques. This inventory also could be associated with other earthquakes such as aftershocks or triggered events. Please check the author methods summary and the original data source for more information on these details and to confirm the viability of this inventory for your specific use. With the exception of the data from USGS sources, the inventory data and associated metadata were not acquired by the U.S. Geological Survey...
Categories: Data;
Types: Citation,
Downloadable,
Map Service,
OGC WFS Layer,
OGC WMS Layer,
Shapefile;
Tags: Caribbean,
EHP,
Earthquake,
Earthquake Hazards Program,
Earthquakes,
Fish collections made at Buck Island Reef National Monument with the ichthyocide rotenone in 2001 at 58 stations followed by 10 days each in April 2011 and January 2012 surveying poorly sampled shoreline habitats with rotenone and clove oil and inland streams with seine. Attached files: Original metadata created at the Southeast Ecological Science Center - Jelks_St_Croix_2001-2012.xml Original dataset provided by M. Cannister - Jelks_St_Croix_2001-2012_orig.csv Enrollment journal used to crosswalk the original data into MBG format - OBIS-USA Enrollment Journal Virgin Islands Jelks 20140626.doc Final MBG version of the data after processing - USGS_StCroix_MarineFishesMBG_20140702.csv Intermediate file created by...
Freshwater fish are among the most vulnerable taxa to climate change globally but are generally understudied in tropical island ecosystems. Climate change is predicted to alter the intensity, frequency, and variability of extreme flow events on the Caribbean island of Puerto Rico. These changes may impact Caribbean native and non-native stream ecosystems and biota complex ways. We compiled an extensive dataset of native and non-native fish assemblages collected at 119 sites across Puerto Rico from 2005 to 2015. We coupled these data with stream flow indices and dam height to understand how flow dynamics drive fish assemblage structure. Sixteen percent of sites contained exclusively non-native species, 34% contained...
Categories: Data,
Publication;
Types: Citation;
Tags: Aquatic Biology,
Caribbean,
Caribbean ecosystems,
Hydrology,
USGS Science Data Catalog (SDC),

Aboveground woody biomass carbon dataset for the Latin American tropics and the Caribbean (~500m spatial resolution) generated by Woods Hole Research Center scientists and their collaborators. The Conservation Biology Institute created a continuous dataset by mosaicing national level biomass data provided by WHRC and converting it to carbon using a coefficient of 0.5 (Chave et al. 2005). The dataset was then converted from Float to Interger data type to minimize file size.The pixel values are in megagrams (Mg) of Aboveground Live Woody Carbon per Hectare (Mg/Ha).WHRC researchers produced national level maps showing the amount and spatial distribution of aboveground live woody vegetation biomass (for the period...
Red lionfish (Pterois volitans) have become a successful invasive predator across the Northwestern Atlantic, Caribbean, and Gulf of Mexico (GoM). Previous investigations have identified the southeast coast of Florida as the original site of introduction, but no region-wide genetic study has directly addressed the question of introduction location(s). This dataset includes previously unpublished red lionfish samples (n = 237) from six locations: The Bahamas, Florida Keys, Northwest Florida, North Carolina, Panama, and Southeast Florida. Sequences archived in NCBI from other locations in the Northern Region, Caribbean, and Gulf of Mexico basins were used in the analyses (N = 1558). Previously published sequences were...
The U.S. Geological Survey (USGS) maintains shoreline positions for the United States coasts from both older sources, such as aerial photographs or topographic surveys, and contemporary sources, such as lidar-point clouds and digital elevation models. These shorelines are compiled and analyzed in the Digital Shoreline Analysis System software to compute their rates of change. Keeping a record of historical shoreline positions is an effective method to monitor change over time, enabling scientists to identify areas most susceptible to erosion or accretion. These data can help coastal managers understand which areas of the coast are vulnerable to change. This data release, and other associated products, represent...
The U.S. Geological Survey (USGS) maintains shoreline positions for the United States' coasts from both older sources, such as aerial photographs or topographic surveys, and contemporary sources, such as lidar-point clouds and digital elevation models. These shorelines are compiled and analyzed in the USGS Digital Shoreline Analysis System (DSAS), version 5.1 software to calculate rates of change. Keeping a record of historical shoreline positions is an effective method to monitor change over time, enabling scientists to identify areas most susceptible to erosion or accretion. These data can help coastal managers understand which areas of the coast are vulnerable to change. This data release, and other associated...
Categories: Data;
Types: Downloadable,
Map Service,
OGC WFS Layer,
OGC WMS Layer,
Shapefile;
Tags: Atlantic Coast,
Baseline,
CMGP,
Caribbean,
Coastal Research and Planning Institute of Puerto Rico,
The U.S. Geological Survey (USGS) maintains shoreline positions for the United States coasts from both older sources, such as aerial photographs or topographic surveys, and contemporary sources, such as lidar-point clouds and digital elevation models. These shorelines are compiled and analyzed in the USGS Digital Shoreline Analysis System (DSAS), version 5.1 software to calculate rates of change. Keeping a record of historical shoreline positions is an effective method to monitor change over time, enabling scientists to identify areas most susceptible to erosion or accretion. These data can help coastal managers understand which areas of the coast are vulnerable to change. This data release, and other associated...
This dataset includes a modified subset of polygon features that describe U.S. Geological Survey's defined geologic provinces of the World. Each province has a set of geologic characteristics that distinguish it from surrounding provinces. These characteristics may include dominant lithologies, the age of the strata, and/or structural type. Each province is assigned a unique numeric code and may fall within two or more countries or assessment regions.
Categories: Data,
pre-SM502.8;
Types: Downloadable,
Map Service,
OGC WFS Layer,
OGC WMS Layer,
Shapefile;
Tags: AG,
AI,
AN,
AW,
Anguilla,
The U.S. Geological Survey (USGS) maintains shoreline positions for the United States coasts from both older sources, such as aerial photographs or topographic surveys, and contemporary sources, such as lidar-point clouds and digital elevation models. These shorelines are compiled and analyzed in the USGS Digital Shoreline Analysis System (DSAS), version 5.1 software to calculate rates of change. Keeping a record of historical shoreline positions is an effective method to monitor change over time, enabling scientists to identify areas most susceptible to erosion or accretion. These data can help coastal managers understand which areas of the coast are vulnerable to change. This data release, and other associated...
Categories: Data;
Types: Downloadable,
Map Service,
OGC WFS Layer,
OGC WMS Layer,
Shapefile;
Tags: Atlantic Coast,
Baseline,
CMGP,
Caribbean,
Coastal Research and Planning Institute of Puerto Rico,
|

|
