Filters: Tags: cm3 (X)
35 results (76ms)|
Filters
Date Range
Contacts Tag Schemes |

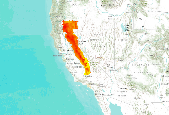
Winter (January – March) precipitation (mm) averaged over 2046-2065 from the general circulation model Hadley CM3 (Gordon et al. 2000, Pope et al. 2000) downscaled to a grid cell size of 10 km x 10km. References: Gordon C., C. Cooper , C.A. Senior, H. Banks, J.M. Gregory, T.C. Johns , J.F.B. Mitchell, and R.A. Wood. 2000. The simulation of SST, sea ice extents and ocean heat transports in a version of the Hadley Centre coupled model without flux adjustments. Clim Dyn 16:147–168. Pope, V.D., M.L. Gallani, P.R. Rowntree, and R.A. Stratton. 2000. The impact of new physical parameterisations in the Hadley Centre climate model – HadAM3. Clim Dyn 16:123–146.

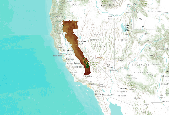
Modal vegetation class over 1986 – 2005, simulated with MC1 (Lenihan et al. 2008) and a 10 km x 10 km grid cell size. Grid Value: Vegetation Type 1: ALPINE 2: SUBALPINE FOREST 3: COAST EVERGREEN FOREST 11: PINYON-JUNIPER 4: SIERRAN EVERGREEN FOREST 6: MIXED EVERGREEN FOREST 15: GREAT BASIN EVERGREEN WOODLAND 10: MIXED EVERGREEN WOODLAND 20: SAGEBRUSH STEPPE 17: C3 GRASSLAND 18: C4 GRASSLAND 19: CHAPARRAL 17: C3 GRASSLAND 18: C4 GRASSLAND 21: DESERT

Simulated fraction of vegetation carbon in forest averaged over 2046-2065 simulated by MC1 (Hayhoe et al. 2004) at a 10 km x 10 km grid cell size under Hadley CM3 (Gordon et al. 2000, Pope et al. 2000) climate projections with A1fi emission levels (Nakic’enovic’ et al. 2000). References: Gordon C., C. Cooper , C.A. Senior, H. Banks, J.M. Gregory, T.C. Johns , J.F.B. Mitchell, and R.A. Wood. 2000. The simulation of SST, sea ice extents and ocean heat transports in a version of the Hadley Centre coupled model without flux adjustments. Clim Dyn 16:147–168. Nakic’enovic’ N, Alcamo J, Davis G, de Vries B, Fenhann J, Gaffin S, Gregory K, Grubler A, Jung TY, Kram T et al. 2000. Intergovernmental panel on climate...

Simulated forest carbon (g C m2) averaged over 2076-2095 simulated by MC1 (Hayhoe et al. 2004) at a 10 km x 10 km grid cell size under Hadley CM3 (Gordon et al. 2000, Pope et al. 2000) climate projections with A1fi emission levels (Nakic’enovic’ et al. 2000). References: Gordon C., C. Cooper , C.A. Senior, H. Banks, J.M. Gregory, T.C. Johns , J.F.B. Mitchell, and R.A. Wood. 2000. The simulation of SST, sea ice extents and ocean heat transports in a version of the Hadley Centre coupled model without flux adjustments. Clim Dyn 16:147–168. Nakic’enovic’ N, Alcamo J, Davis G, de Vries B, Fenhann J, Gaffin S, Gregory K, Grubler A, Jung TY, Kram T et al. 2000. Intergovernmental panel on climate change special report...
Simulated fraction of vegetation carbon burned averaged over 2046-2065 simulated by MC1 (Hayhoe et al. 2004) at a 10 km x 10 km grid cell size under Hadley CM3 (Gordon et al. 2000, Pope et al. 2000) climate projections with A1fi emission levels (Nakic’enovic’ et al. 2000). References: Gordon C., C. Cooper , C.A. Senior, H. Banks, J.M. Gregory, T.C. Johns , J.F.B. Mitchell, and R.A. Wood. 2000. The simulation of SST, sea ice extents and ocean heat transports in a version of the Hadley Centre coupled model without flux adjustments. Clim Dyn 16:147–168. Nakic’enovic’ N, Alcamo J, Davis G, de Vries B, Fenhann J, Gaffin S, Gregory K, Grubler A, Jung TY, Kram T et al. 2000. Intergovernmental panel on climate change...

Mean forest carbon (g C m2; 1986 – 2005), simulated with MC1 (Lenihan et al. 2008) and a 10 km x 10km grid cell size.
Simulated forest carbon (g C m2) averaged over 2046-2065 simulated by MC1 (Hayhoe et al. 2004) at a 10 km x 10 km grid cell size under Hadley CM3 (Gordon et al. 2000, Pope et al. 2000) climate projections with A1fi emission levels (Nakic’enovic’ et al. 2000). References: Gordon C., C. Cooper , C.A. Senior, H. Banks, J.M. Gregory, T.C. Johns , J.F.B. Mitchell, and R.A. Wood. 2000. The simulation of SST, sea ice extents and ocean heat transports in a version of the Hadley Centre coupled model without flux adjustments. Clim Dyn 16:147–168. Nakic’enovic’ N, Alcamo J, Davis G, de Vries B, Fenhann J, Gaffin S, Gregory K, Grubler A, Jung TY, Kram T et al. 2000. Intergovernmental panel on climate change special report...

Mean difference between maximum and minimum temperatures during summer (July - September) averaged over 2046-2065 from the general circulation model Hadley CM3 (Gordon et al. 2000, Pope et al. 2000) downscaled to a grid cell size of 10 km x 10km. References: Gordon C., C. Cooper , C.A. Senior, H. Banks, J.M. Gregory, T.C. Johns , J.F.B. Mitchell, and R.A. Wood. 2000. The simulation of SST, sea ice extents and ocean heat transports in a version of the Hadley Centre coupled model without flux adjustments. Clim Dyn 16:147–168. Pope, V.D., M.L. Gallani, P.R. Rowntree, and R.A. Stratton. 2000. The impact of new physical parameterisations in the Hadley Centre climate model – HadAM3. Clim Dyn 16:123–146.

Vegetation carbon (g C m2) averaged over 2046-2065 simulated by MC1 (Hayhoe et al. 2004) at a 10 km x 10 km grid cell size under Hadley CM3 (Gordon et al. 2000, Pope et al. 2000) climate projections with A1fi emission levels (Nakic’enovic’ et al. 2000). References: Gordon C., C. Cooper , C.A. Senior, H. Banks, J.M. Gregory, T.C. Johns , J.F.B. Mitchell, and R.A. Wood. 2000. The simulation of SST, sea ice extents and ocean heat transports in a version of the Hadley Centre coupled model without flux adjustments. Clim Dyn 16:147–168. Nakic’enovic’ N, Alcamo J, Davis G, de Vries B, Fenhann J, Gaffin S, Gregory K, Grubler A, Jung TY, Kram T et al. 2000. Intergovernmental panel on climate change special report on...

Mean maximum temperature (°C) averaged over 2046-2065 from the general circulation model Hadley CM3 (Gordon et al. 2000, Pope et al. 2000) downscaled to a grid cell size of 10 km x 10km. References: Gordon C., C. Cooper , C.A. Senior, H. Banks, J.M. Gregory, T.C. Johns , J.F.B. Mitchell, and R.A. Wood. 2000. The simulation of SST, sea ice extents and ocean heat transports in a version of the Hadley Centre coupled model without flux adjustments. Clim Dyn 16:147–168. Pope, V.D., M.L. Gallani, P.R. Rowntree, and R.A. Stratton. 2000. The impact of new physical parameterisations in the Hadley Centre climate model – HadAM3. Clim Dyn 16:123–146.

Future modal vegetation class over 2076-2095, simulated with MC1 (Hayhoe et al. 2004) and a 10 km x 10 km grid cell size under the A1fi emissions scenario with the Hadley CM3 GCM model (Gordon et al. 2000, Pope et al. 2000). Grid Value: Vegetation Type 1: ALPINE 2: SUBALPINE FOREST 3: COAST EVERGREEN FOREST 11: PINYON-JUNIPER 4: SIERRAN EVERGREEN FOREST 6: MIXED EVERGREEN FOREST 15: GREAT BASIN EVERGREEN WOODLAND 10: MIXED EVERGREEN WOODLAND 20: SAGEBRUSH STEPPE 17: C3 GRASSLAND 18: C4 GRASSLAND 19: CHAPARRAL 17: C3 GRASSLAND 18: C4 GRASSLAND 21: DESERT References: Gordon C., C. Cooper , C.A. Senior, H. Banks, J.M. Gregory, T.C. Johns , J.F.B. Mitchell, and R.A. Wood. 2000. The simulation...

Predicted probability of fisher year-round occurrence derived from future (2046-2065) climate projections and vegetation simulations. Projected fisher distribution was created with Maxent (Phillips et al. 2006) using fisher detections (N = 302, spanning 1990 – 2011) and five predictor variables: mean annual precipitation, mean summer (July – September) precipitation, mean understory index (fraction of grass vegetation carbon in forest), mean forest carbon (g C m2), and mean fraction of vegetation carbon in forest. Future climate drivers were generated using statistical downscaling (simple delta method) of general circulation model projections, in this case Hadley CM3 (Johns et al. 2003) under the A2 emission scenario...

Mean vegetation carbon (g C m2; 1986 – 2005), simulated with MC1 (Lenihan et al. 2008) and a 10 km x 10 km grid cell size.

Mean fraction of vegetation carbon in forest (1986 – 2005), simulated with MC1 (Lenihan et al. 2008) and a 10 km x 10 km grid cell size.

Simulated understory index (fraction of grass vegetation carbon in forest, ((aglivcx + bglivcx) / frstc)) averaged over 2076-2095 simulated by MC1 (Hayhoe et al. 2004) at a 10 km x 10 km grid cell size under Hadley CM3 (Gordon et al. 2000, Pope et al. 2000) climate projections with A1fi emission levels (Nakic’enovic’ et al. 2000). References: Gordon C., C. Cooper , C.A. Senior, H. Banks, J.M. Gregory, T.C. Johns , J.F.B. Mitchell, and R.A. Wood. 2000. The simulation of SST, sea ice extents and ocean heat transports in a version of the Hadley Centre coupled model without flux adjustments. Clim Dyn 16:147–168. Nakic’enovic’ N, Alcamo J, Davis G, de Vries B, Fenhann J, Gaffin S, Gregory K, Grubler A, Jung TY,...

Simulated fraction of vegetation carbon burned averaged over 2076-2095 simulated by MC1 (Hayhoe et al. 2004) at a 10 km x 10 km grid cell size under Hadley CM3 (Gordon et al. 2000, Pope et al. 2000) climate projections with A1fi emission levels (Nakic’enovic’ et al. 2000). References: Gordon C., C. Cooper , C.A. Senior, H. Banks, J.M. Gregory, T.C. Johns , J.F.B. Mitchell, and R.A. Wood. 2000. The simulation of SST, sea ice extents and ocean heat transports in a version of the Hadley Centre coupled model without flux adjustments. Clim Dyn 16:147–168. Nakic’enovic’ N, Alcamo J, Davis G, de Vries B, Fenhann J, Gaffin S, Gregory K, Grubler A, Jung TY, Kram T et al. 2000. Intergovernmental panel on climate change...

Winter (January – March) minimum temperature (°C) averaged over 1986 – 2005, with a grid cell size of 10 km x 10km, provided by the PRISM group (Daly et al. 1994).

Mean minimum temperature (°C) averaged over 2046-2065 from the general circulation model Hadley CM3 (Gordon et al. 2000, Pope et al. 2000) downscaled to a grid cell size of 10 km x 10km. References: Gordon C., C. Cooper , C.A. Senior, H. Banks, J.M. Gregory, T.C. Johns , J.F.B. Mitchell, and R.A. Wood. 2000. The simulation of SST, sea ice extents and ocean heat transports in a version of the Hadley Centre coupled model without flux adjustments. Clim Dyn 16:147–168. Pope, V.D., M.L. Gallani, P.R. Rowntree, and R.A. Stratton. 2000. The impact of new physical parameterisations in the Hadley Centre climate model – HadAM3. Clim Dyn 16:123–146.

Mean annual precipitation averaged over 2076-2095 from the general circulation model Hadley CM3 (Gordon et al. 2000, Pope et al. 2000) downscaled to a grid cell size of 10 km x 10km. References: Gordon C., C. Cooper , C.A. Senior, H. Banks, J.M. Gregory, T.C. Johns , J.F.B. Mitchell, and R.A. Wood. 2000. The simulation of SST, sea ice extents and ocean heat transports in a version of the Hadley Centre coupled model without flux adjustments. Clim Dyn 16:147–168. Pope, V.D., M.L. Gallani, P.R. Rowntree, and R.A. Stratton. 2000. The impact of new physical parameterisations in the Hadley Centre climate model – HadAM3. Clim Dyn 16:123–146.

Vegetation carbon (g C m2) averaged over 2076-2095 simulated by MC1 (Hayhoe et al. 2004) at a 10 km x 10 km grid cell size under Hadley CM3 (Gordon et al. 2000, Pope et al. 2000) climate projections with A1fi emission levels (Nakic’enovic’ et al. 2000). References: Gordon C., C. Cooper , C.A. Senior, H. Banks, J.M. Gregory, T.C. Johns , J.F.B. Mitchell, and R.A. Wood. 2000. The simulation of SST, sea ice extents and ocean heat transports in a version of the Hadley Centre coupled model without flux adjustments. Clim Dyn 16:147–168. Nakic’enovic’ N, Alcamo J, Davis G, de Vries B, Fenhann J, Gaffin S, Gregory K, Grubler A, Jung TY, Kram T et al. 2000. Intergovernmental panel on climate change special report on...
|

|
