Filters: Tags: ecpc (X)
52 results (83ms)|
Filters
Date Range
Contacts Tag Schemes |

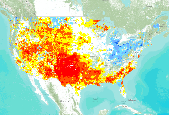
The Palmer Drought Severity Index (PDSI) is a measure of drought derived from both precipitation and temperature. Negative (i.e., dry) values of PDSI are closely associated with a high potential for wildland fire. PDSI is based on a supply-and-demand model of soil moisture originally developed by Wayne Palmer, who published his method in the 1965 paper Meteorological Drought for the Office of Climatology of the U.S. Weather Bureau.The index has proven to be most effective in indicating long-term drought (or wetness) over a matter of several months. PDSI calculations are standardized for an individual station (or grid cell) based on the long-term variability of precipitation and temperature at that location....

The Standardized Precipitation Index (SPI) is a probability index that can be calculated for different time periods to indicate periods of abnormal wetness or dryness. SPI is derived solely from monthly precipitation and can be compared across regions with different climates. The SPI is an index based on the probability of recording a given amount of precipitation, and the probabilities are standardized so that an index of zero indicates the median precipitation amount (half of the historical precipitation amounts are below the median, and half are above the median). This dataset shows the average 12-month SPI (in classes ranging from extremely wet to extremely dry) for the three-month forecast period indentified...

The Palmer Drought Severity Index (PDSI) is a measure of drought derived from both precipitation and temperature. Negative (i.e., dry) values of PDSI are closely associated with a high potential for wildland fire. PDSI is based on a supply-and-demand model of soil moisture originally developed by Wayne Palmer, who published his method in the 1965 paper Meteorological Drought for the Office of Climatology of the U.S. Weather Bureau.The index has proven to be most effective in indicating long-term drought (or wetness) over a matter of several months. PDSI calculations are standardized for an individual station (or grid cell) based on the long-term variability of precipitation and temperature at that location....

The Palmer Drought Severity Index (PDSI) is a measure of drought derived from both precipitation and temperature. Negative (i.e., dry) values of PDSI are closely associated with a high potential for wildland fire. PDSI is based on a supply-and-demand model of soil moisture originally developed by Wayne Palmer, who published his method in the 1965 paper Meteorological Drought for the Office of Climatology of the U.S. Weather Bureau.The index has proven to be most effective in indicating long-term drought (or wetness) over a matter of several months. PDSI calculations are standardized for an individual station (or grid cell) based on the long-term variability of precipitation and temperature at that location....

This dataset shows the predicted area of high fire potential for the current year up to the end of the forecast period as simulated by a modified version of the MC1 Dynamic General Vegetation Model (DGVM). The area of high fire potential is where PDSI and MC1-calculated values of potential fire behavior (fireline intensity for forest and shrubland and rate of spread of spread for grassland) exceed calibrated threshold values. Potential fire behavior in MC1 is estimated using National Fire Danger Rating System (NFDRS) formulas, monthly climatic (temperature, precipitation, and relative humidity) data, and fuel moisture and loading estimates. Monthly climatic data includes recorded values up to the last observed...

The Palmer Drought Severity Index (PDSI) is a measure of drought derived from both precipitation and temperature. Negative (i.e., dry) values of PDSI are closely associated with a high potential for wildland fire. PDSI is based on a supply-and-demand model of soil moisture originally developed by Wayne Palmer, who published his method in the 1965 paper Meteorological Drought for the Office of Climatology of the U.S. Weather Bureau.The index has proven to be most effective in indicating long-term drought (or wetness) over a matter of several months. PDSI calculations are standardized for an individual station (or grid cell) based on the long-term variability of precipitation and temperature at that location....

The Standardized Precipitation Index (SPI) is a probability index that can be calculated for different time periods to indicate periods of abnormal wetness or dryness. SPI is derived solely from monthly precipitation and can be compared across regions with different climates. The SPI is an index based on the probability of recording a given amount of precipitation, and the probabilities are standardized so that an index of zero indicates the median precipitation amount (half of the historical precipitation amounts are below the median, and half are above the median). This dataset shows the average 12-month SPI (in classes ranging from extremely wet to extremely dry) for the three-month forecast period indentified...

This dataset shows the predicted area of high fire potential for the current year up to the end of the forecast period as simulated by a modified version of the MC1 Dynamic General Vegetation Model (DGVM). The area of high fire potential is where PDSI and MC1-calculated values of potential fire behavior (fireline intensity for forest and shrubland and rate of spread of spread for grassland) exceed calibrated threshold values. Potential fire behavior in MC1 is estimated using National Fire Danger Rating System (NFDRS) formulas, monthly climatic (temperature, precipitation, and relative humidity) data, and fuel moisture and loading estimates. Monthly climatic data includes recorded values up to the last observed...

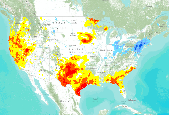
Standardized precipitation index forecast August-December 2011 (based on ECPC 7-mo weather forecast)
The Standardized Precipitation Index (SPI) is a probability index that can be calculated for different time periods to indicate periods of abnormal wetness or dryness. SPI is derived solely from monthly precipitation and can be compared across regions with different climates. The SPI is an index based on the probability of recording a given amount of precipitation, and the probabilities are standardized so that an index of zero indicates the median precipitation amount (half of the historical precipitation amounts are below the median, and half are above the median). This dataset shows the average 12-month SPI (in classes ranging from extremely wet to extremely dry) for the three-month forecast period indentified...

The Standardized Precipitation Index (SPI) is a probability index that can be calculated for different time periods to indicate periods of abnormal wetness or dryness. SPI is derived solely from monthly precipitation and can be compared across regions with different climates. The SPI is an index based on the probability of recording a given amount of precipitation, and the probabilities are standardized so that an index of zero indicates the median precipitation amount (half of the historical precipitation amounts are below the median, and half are above the median). This dataset shows the average 12-month SPI (in classes ranging from extremely wet to extremely dry) for the three-month forecast period indentified...

The Palmer Drought Severity Index (PDSI) is a measure of drought derived from both precipitation and temperature. Negative (i.e., dry) values of PDSI are closely associated with a high potential for wildland fire. PDSI is based on a supply-and-demand model of soil moisture originally developed by Wayne Palmer, who published his method in the 1965 paper Meteorological Drought for the Office of Climatology of the U.S. Weather Bureau.The index has proven to be most effective in indicating long-term drought (or wetness) over a matter of several months. PDSI calculations are standardized for an individual station (or grid cell) based on the long-term variability of precipitation and temperature at that location....

The Palmer Drought Severity Index (PDSI) is a measure of drought derived from both precipitation and temperature. Negative (i.e., dry) values of PDSI are closely associated with a high potential for wildland fire. PDSI is based on a supply-and-demand model of soil moisture originally developed by Wayne Palmer, who published his method in the 1965 paper Meteorological Drought for the Office of Climatology of the U.S. Weather Bureau.The index has proven to be most effective in indicating long-term drought (or wetness) over a matter of several months. PDSI calculations are standardized for an individual station (or grid cell) based on the long-term variability of precipitation and temperature at that location....

The Standardized Precipitation Index (SPI) is a probability index that can be calculated for different time periods to indicate periods of abnormal wetness or dryness. SPI is derived solely from monthly precipitation and can be compared across regions with different climates. The SPI is an index based on the probability of recording a given amount of precipitation, and the probabilities are standardized so that an index of zero indicates the median precipitation amount (half of the historical precipitation amounts are below the median, and half are above the median). This dataset shows the average 12-month SPI (in classes ranging from extremely wet to extremely dry) for the three-month forecast period indentified...

The Palmer Drought Severity Index (PDSI) is a measure of drought derived from both precipitation and temperature. Negative (i.e., dry) values of PDSI are closely associated with a high potential for wildland fire. PDSI is based on a supply-and-demand model of soil moisture originally developed by Wayne Palmer, who published his method in the 1965 paper Meteorological Drought for the Office of Climatology of the U.S. Weather Bureau.The index has proven to be most effective in indicating long-term drought (or wetness) over a matter of several months. PDSI calculations are standardized for an individual station (or grid cell) based on the long-term variability of precipitation and temperature at that location....
The Palmer Drought Severity Index (PDSI) is a measure of drought derived from both precipitation and temperature. Negative (i.e., dry) values of PDSI are closely associated with a high potential for wildland fire. PDSI is based on a supply-and-demand model of soil moisture originally developed by Wayne Palmer, who published his method in the 1965 paper Meteorological Drought for the Office of Climatology of the U.S. Weather Bureau.The index has proven to be most effective in indicating long-term drought (or wetness) over a matter of several months. PDSI calculations are standardized for an individual station (or grid cell) based on the long-term variability of precipitation and temperature at that location....

The Standardized Precipitation Index (SPI) is a probability index that can be calculated for different time periods to indicate periods of abnormal wetness or dryness. SPI is derived solely from monthly precipitation and can be compared across regions with different climates. The SPI is an index based on the probability of recording a given amount of precipitation, and the probabilities are standardized so that an index of zero indicates the median precipitation amount (half of the historical precipitation amounts are below the median, and half are above the median). This dataset shows the average 12-month SPI (in classes ranging from extremely wet to extremely dry) for the three-month forecast period indentified...
|

|
