Filters: Tags: environment (X)
13,654 results (46ms)|
Filters
Date Range
Extensions Types
Contacts
Categories Tag Types
|
The glacial aquifer system of the United States encompasses all or parts of 25 states and is the most widely used supply of drinking water in the Nation (Maupin and Barber, 2005; Maupin and Arnold, 2010). A series of seven raster data sets were derived from a database of water-well drillers' records that was compiled in partial fulfillment of the goals of the U.S. Geological Survey’s Groundwater Availability and Use assessment program (U.S. Geological Survey, 2002). They contain hydrogeologic information for areas of the U.S. that are north of the southern limit of Pleistocene glaciation, including the total thickness of glacial deposits, thickness of coarse-grained sediment within the glacial deposits, specific-capacity...
Future climates are simulated by general circulation models (GCM) using climate change scenarios (IPCC 2014). To project climate change for the sagebrush biome, we used 11 GCMs and two climate change scenarios from the IPCC Fifth Assessment, representative concentration pathways (RCPs) 4.5 and 8.5 (Moss et al. 2010, Van Vuuren et al. 2011). RCP4.5 scenario represents a future where climate policies limit and achieve stabilization of greenhouse gas concentrations to 4.5 W m-2 by 2100. RCP8.5 scenario might be called a business-as-usual scenario, where high emissions of greenhouse gases continue in the absence of climate change policies. The two selected time frames allow comparison of near-term (2020-2050) and longer-term...
Categories: Data;
Types: Citation,
Downloadable,
GeoTIFF,
Map Service,
Raster;
Tags: Arizona,
CRS,
California,
Climate,
Colorado,
This data set shows the extent of the Colorado River Conservation Planning project bottomland area as delineated by topography and vegetation, The bottomland area is subdivided into 1 km polygons measured from the upstream project boundary. Reach breaks were determined by large topographic shifts and/or tributary junctions by John Dohrenwend. Please see the project report for more details.
Categories: Data;
Types: Downloadable,
Map Service,
OGC WFS Layer,
OGC WMS Layer,
Shapefile;
Tags: Arches National Park,
Canyonlands National Park,
Colorado River,
Grand County,
Moab,
This data release contains coastal wetland synthesis products for the geographic region from Jamaica Bay to western Great South Bay, located in southeastern New York State. Metrics for resiliency, including unvegetated to vegetated ratio (UVVR), marsh elevation, and mean tidal range, are calculated for smaller units delineated from a Digital Elevation Model, providing the spatial variability of physical factors that influence wetland health. Through scientific efforts initiated with the Hurricane Sandy Science Plan, the U.S. Geological Survey has been expanding national assessment of coastal change hazards and forecast products to coastal wetlands with the intent of providing Federal, State, and local managers with...
Types: Map Service,
OGC WFS Layer,
OGC WMS Layer,
OGC WMS Service;
Tags: Atlantic Ocean,
Environmental Health,
Hydrology,
Jamaica Bay,
LTER,
This dataset provides the results of an assessment of estuary habitat condition in the conterminous United States. To analyze estuary condition, a cumulative disturbance index was developed based on habitat stressor variable data available at a national scale for anthropogenic disturbances measured within estuaries and their associated watersheds. Twenty-eight variables were combined within stressor categories to develop four sub-indices of disturbance for land use, alterations of river flows, pollution sources, and estuary eutrophication. These four sub-indices of disturbance were then combined to develop cumulative disturbance index scores for each estuary. This index describes the estimated combined stress on...
(Hyperlink to Official Landing Page for Geospatial Fabric products) The Geospatial Fabric provides a consistent, documented, and topologically connected set of spatial features that create an abstracted stream/basin network of features useful for hydrologic modeling.The GIS vector features contained in this Geospatial Fabric (GF) data set cover the lower 48 U.S. states, Hawaii, and Puerto Rico. Four GIS feature classes are provided for each Region: 1) the Region outline ("one"), 2) Points of Interest ("POIs"), 3) a routing network ("nsegment"), and 4) Hydrologic Response Units ("nhru"). A graphic showing the boundaries for all Regions is provided at http://dx.doi.org/doi:10.5066/F7542KMD. These Regions are identical...
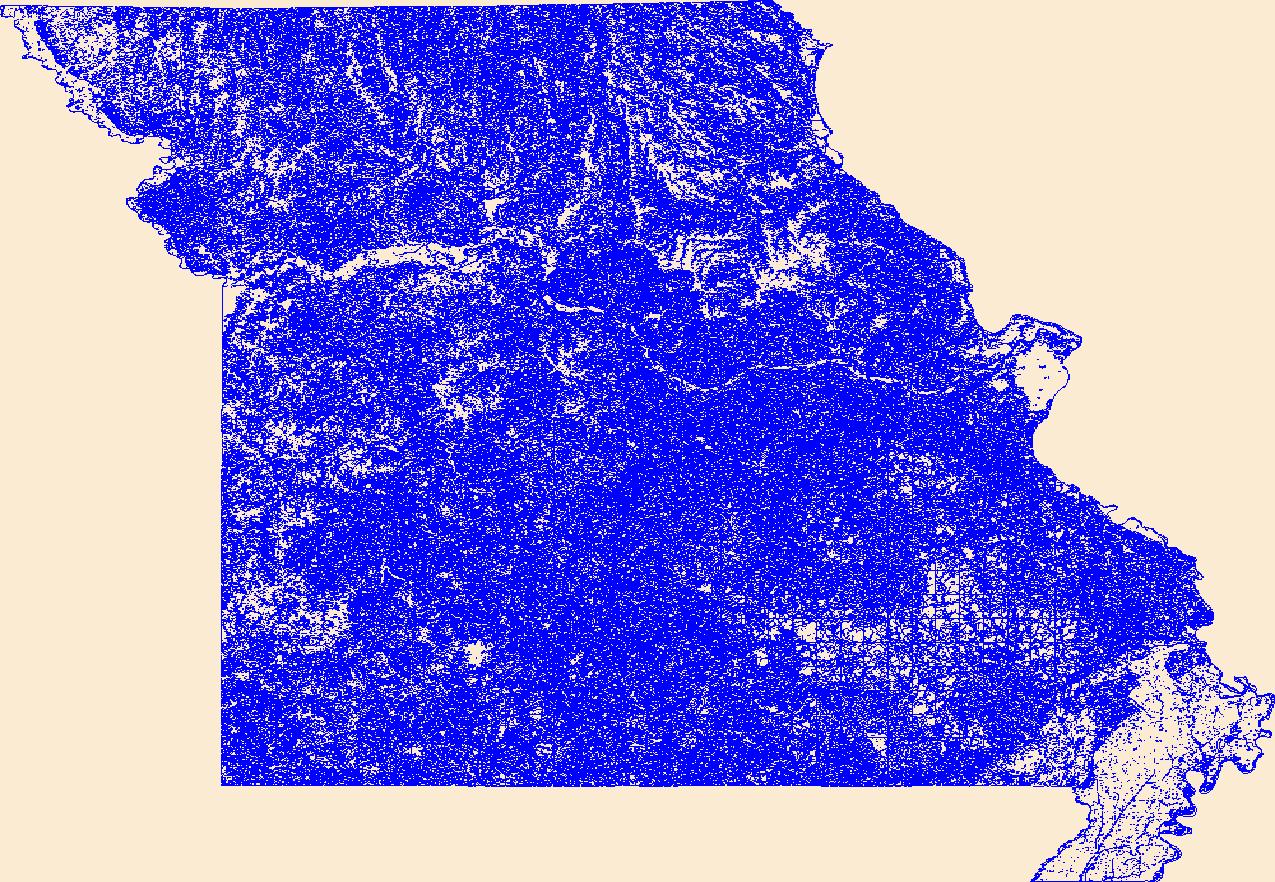
Geospatial data that is a derivative land cover product depicting woodland on topographic maps.

This part of DS 781 presents data for bathymetry for several seafloor maps of the Offshore of Point Conception Map Area, California. The vector data file is included in "BathymetryHS_OffshorePointConception.zip," which is accessible from https://doi.org/10.5066/F7QN64XQ. Shaded-relief bathymetry of the Offshore of Point Conception map area in southern California was generated largely from acoustic-bathymetry data collected by Fugro Pelagos Inc. Acoustic mapping was completed in 2008 using a combination of 400-kHz Reson 7125, 240-kHz Reson 8101, and 100-kHz Reson 8111 multibeam echosounders. Bathymetric-lidar data was collected in the nearshore area by the U.S. Army Corps of Engineers (USACE) Joint Lidar Bathymetry...
A compilation of all known nest records and locations to identify landscape-scale parameters (distance to coast, elevation, slope, and land cover) that provide potential nesting habitat in four regions: northern Alaska, Aleutian Islands, Alaska Peninsula Mountains and Kodiak Island, and Pacific Coastal Mountains (including nearshore interior Canada). These data support the following publication: Felis J.J., Kissling M.L., Kaler R.S.A., Kenney L.A., Lawonn M.J., 2016. Identifying Kittlitz’s Murrelet nesting habitat in North America at the landscape scale. Journal of Fish and Wildlife Management 7(2):xx-xx; e1944-687X. doi: 10.3996/112015-JFWM-116
Categories: Data;
Types: Citation,
Map Service,
OGC WFS Layer,
OGC WMS Layer,
OGC WMS Service;
Tags: biota,
environment,
health,
oceans
This release contains Active Layer Thickness (ALT) and Organic Layer Thickness (OLT) measurements measured along transects in Alaska, 2015. Site condition information in terms of wildfire burns is also included.
Categories: Data;
Types: Citation;
Tags: Active layer,
Active layer thickness,
Alaska,
Borehole nuclear magnetic resonance,
Chatanika,
This dataset represents an archived record of annual California sea otter surveys from 1985-2014. Survey procedures involve counting animals during the "spring survey" -- generally beginning in late April or early May and usually ending in late May early June but may extend into early July, depending on weather conditions. Annual surveys are organized by survey year and within each year, three shapefiles are included: census summary of southern sea otter, extra limit counts of southern sea otter, and range extent of southern sea otter. The surveys, conducted cooperatively by scientists of the U.S. Geological Survey, California Department of Fish and Wildlife, U.S. Fish and Wildlife Service and Monterey Bay Aquarium...
Categories: Data;
Tags: California,
Central California Coastal,
Coast,
Southern California Coastal,
USGS Science Data Catalog (SDC),
Density of all roads within a 5-km radius developed using a circular focal moving window analysis.
Categories: Data;
Types: Downloadable,
GeoTIFF,
Map Service,
Raster;
Tags: Colorado,
Idaho,
Montana,
United States,
Utah,
The Polygons represent the USGS NHD 12 digit HUC polygons which contain known winter roost trees for Northern long-eared bat (Myotis septentrionalis).
Categories: Data;
Types: Downloadable,
Map Service,
OGC WFS Layer,
OGC WMS Layer,
Shapefile;
Tags: Administrative Units,
Biogeographical regions,
Biota,
Natural risk zones,
Protected sites,
Proportion of all sagebrush species land cover within a 1-km radius developed using a circular focal moving window analysis.
Categories: Data;
Types: Downloadable,
GeoTIFF,
Map Service,
Raster;
Tags: Artemisia spp.,
Colorado,
Idaho,
Montana,
United States,
This is a model showing general habitat diversity, including both the structural and cover type diversity. See Open File Report, Rasmussen and Shafroth, Colorado River Conservation Planning for geoprocessing details.
Categories: Data;
Types: Citation,
Downloadable,
Map Service,
OGC WFS Layer,
OGC WMS Layer,
Shapefile;
Tags: Arches National Park,
Canyonlands National Park,
Colorado River,
Grand County,
Moab,
Proportion of salt desert shrub land cover within a 1-km radius developed using a circular focal moving window analysis.
This data set includes WRTDS nutrient flux trend results and the values of daily streamflow trend results displayed in the Quantile-Kendall plots. For 1995-2015 nutrient trends, the method of generalized flow normalization (FNG) was used which explicitly addresses non-stationary streamflow conditions. For 2005-2015 nutrient trends, the WRTDS trend analyses used the method of stationary flow normalization (FNS) because streamflow nonstationarity is difficult to assess over this shorter duration time frame. The 1995-2015 annual nutrient trends were determined for all five nutrient parameters (TP, SRP, TN, NO23, TKN), and monthly trends were evaluated only for SRP. The 2005-2015 annual nutrient trends were determined...
The diversion of freshwater from the Mississippi River is intended to mitigate saltwater intrusion from the Gulf of Mexico and to lessen the concomitant loss of wetland areas. Though effective, freshwater diversion can affect wildlife and habitat; therefore, prediversion and postdiversion data collections are necessary to identify effects. The Davis Pond freshwater diversion area is located between the Mississippi River and Bayou Lafourche and extends to Barataria Bay Basin, Louisiana. Results and interpretations from the prediversion biomonitoring done in 2001- which included data on fish, eagles, and bivalves - are presented in the U.S. Geological Survey (USGS) Scientific Investigations Report 2008-5067, "Davis...
The diversion of freshwater from the Mississippi River is intended to mitigate saltwater intrusion from the Gulf of Mexico and to lessen the concomitant loss of wetland areas. Though effective, freshwater diversion can affect wildlife and habitat; therefore, prediversion and postdiversion data collections are necessary to identify effects. The Davis Pond freshwater diversion area is located between the Mississippi River and Bayou Lafourche and extends to Barataria Bay Basin, Louisiana. Results and interpretations from the prediversion biomonitoring done in 2001- which included data on fish, eagles, and bivalves - are presented in the U.S. Geological Survey (USGS) Scientific Investigations Report 2008-5067, "Davis...
The diversion of freshwater from the Mississippi River is intended to mitigate saltwater intrusion from the Gulf of Mexico and to lessen the concomitant loss of wetland areas. Though effective, freshwater diversion can affect wildlife and habitat; therefore, prediversion and postdiversion data collections are necessary to identify effects. The Davis Pond freshwater diversion area is located between the Mississippi River and Bayou Lafourche and extends to Barataria Bay Basin, Louisiana. Results and interpretations from the prediversion biomonitoring done in 2001- which included data on fish, eagles, and bivalves - are presented in the U.S. Geological Survey (USGS) Scientific Investigations Report 2008-5067, "Davis...
|

|
