Filters: Tags: evapotranspiration (X)
260 results (40ms)|
Filters
Date Range
Extensions Types Contacts
Categories Tag Types
|

These data were released prior to the October 1, 2016 effective date for the USGS’s policy dictating the review, approval, and release of scientific data as referenced in USGS Survey Manual Chapter 502.8 Fundamental Science Practices: Review and Approval of Scientific Data for Release. The data in this release are associated with the U.S. Geological Survey Open-File Report: Snyder, D.T., Risley, J.C., and Haynes, J.V., 2012, Hydrological information products for the Off-Project Water Program of the Klamath Basin Restoration Agreement: U.S. Geological Survey Open-File Report 2012–1199, 20 p., https://pubs.usgs.gov/of/2012/1199

The shapefile associated with this metadata file represents the spatial distribution of mean annual water-budget components, in inches, for the Island of Oahu, Hawaii. The water-budget components in the shapefile were computed by a water-budget model for a scenario representative of average climate conditions (1978–2007 rainfall) and 2010 land cover, as described in USGS Scientific Investigations Report (SIR) 2015-5010. The model was developed for estimating groundwater recharge and other water-budget components for each subarea of the model. The model subareas were generated using Esri ArcGIS software by intersecting (merging) multiple spatial data sets that characterize the spatial distribution of rainfall, fog...
These data were released prior to the October 1, 2016 effective date for the USGS’s policy dictating the review, approval, and release of scientific data as referenced in USGS Survey Manual Chapter 502.8 Fundamental Science Practices: Review and Approval of Scientific Data for Release. The digital data set provides locations and general descriptions of sites instrumented to collect micrometeorological data from which mean annual ET rates were computed. Sites are located in Ash Meadows and Oasis Valley, Nevada. Data were collected December 1993 through present.

This dataset represents "phreatophyte areas" mapped as part of a groundwater reconnaissance effort in four valleys in central Nevada and published in 1964. The data were digitized for comparison with mapping of groundwater discharge areas done in 2011 as part of a groundwater study in these valleys published in 2016.
The files on this page contain the data used for the research described in in the paper, "Challenges in complementing data from ground-based sensors with satellite-derived products to measure ecological changes in relation to climate – lessons from temperate wetland-upland landscapes" (Gallant, A.L., Sadinski, W., Brown, J.F., Senay, G.B., Roth, M.F. 2018. Sensors). Supplementary Datafile 1 contains data on evapotranspiration, vegetation response (Normalized Difference Vegetation Index), snow-off timing, growing degree units, and precipitation. Supplementary Datafile 2 contains the corner coordinates of the study blocks to which the environmental data apply. The field "BlockSite" is common to both files and can...
The release of the saltcedar beetle (Diorhabda carinulata) has resulted in the periodic defoliation of tamarisk (Tamarix spp.) along more than 1000 river km in the upper Colorado River Basin and is expected to spread along many other river reaches throughout the upper basin, and possibly into the lower Colorado River Basin. Identifying the impacts of these release programs on tamarisk water use and subsequent water cycling in arid riparian systems are largely unknown, due in part to the difficulty of measuring water fluxes in these systems. We used lab-calibrated, modified heat-dissipation sap flux sensors to monitor tamarisk water use (n = 20 trees) before, during and after defoliation by the saltcedar leaf beetle...
Categories: Publication;
Types: Citation,
Journal Citation;
Tags: Agricultural and Forest Meteorology,
Ecohydrology,
Evapotranspiration,
Saltcedar leaf beetle,
Sap flux,
Physiological activity and structural dynamics in arid and semi-arid ecosystems are driven by discrete inputs or "pulses" of growing season precipitation. Here we describe the short-term dynamics of ecosystem physiology in experimental stands of native (Heteropogon contortus) and invasive (Eragrostis lehmanniana) grasses to an irrigation pulse across two geomorphic surfaces with distinctly different soils: a Pleistocene-aged surface with high clay content in a strongly horizonated soil, and a Holocene-aged surface with low clay content in homogenously structured soils. We evaluated whole-ecosystem and leaf-level CO2 and H2O exchange, soil CO2 efflux, along with plant and soil water status to understand potential...
Categories: Publication;
Types: Citation,
Journal Citation;
Tags: Oecologia,
Santa Rita Experimental Range,
Springer Berlin / Heidelberg,
evapotranspiration,
invasive species,
Early succession aspen and late succession conifer forests have different architecture and physiology affecting hydrologic transfer processes. An evaluation of water pools and fluxes was used to determine differences in the hydrologic dynamics between stands of quaking aspen (Populus tremuloides) and associated stands of mixed conifer consisting of white fir (Abies concolor), Douglas-fir (Pseudotsuga menziesii), and Engelmann spruce (Picea engelmannii). In 2005 and 2006, measurements of snow water accumulation, snow ablation (melt), soil water content, snowpack sublimation, and evapotranspiration (ET) were measured in adjacent aspen and conifer stands. Peak snow water equivalent (SWE) averaged 34–44% higher in...
Categories: Publication;
Types: Citation,
Journal Citation;
Tags: Ecosystems,
Springer New York,
douglas-fir,
evapotranspiration,
quaking aspen,
This is the first of two datasets containing derived data necessary to reproduce the results of the associated journal article: "On the Sensitivity of Annual Streamflow to Air Temperature." This first dataset contains basic basin characteristics of 2,673 gaged basins worldwide, along with associated monthly time series of basin-mean precipitation, air temperature, and net radiation. The streamflow data themselves are available directly from the Global Runoff Data Centre. From the inventory of discharge data holdings of the Global Runoff Data Centre, 2,673 stream gages were selected for which (1) at least 25 complete calendar years of monthly data overlapped in time with available climate data; (2) 500-m-resolution...
These data were compiled for monitoring riparian zone trends and changes in the Lower Colorado Delta as part of the Minute 139 of the 1944 Water Treaty between the United States and Mexico. The quality and quantity of the Delta’s riparian and aquatic ecosystems have been dramatically reduced over the past century, due largely to significant alterations to natural hydrologic and sediment regimes. The Minute 319 Agreement states that 130 million cubic meters of water was to be released during the spring of 2014. Water was released from Morelos Dam at the Northern International Border (NIB) near Yuma, Arizona, to the river’s delta in Mexico, allowing water to reach the Gulf of California for the first time in 13 years...
The dataset includes a table in comma delimited format of daily evapotranspiration (ET) from 6/14/2018 to 12/31/2020 from an ET station within the Blue Cypress Marsh Conservation Area, within Indian River County, Florida. Evapotranspiration was estimated using eddy-covariance methods and missing records were gap-filled with a version of the Turc equation (Trajkovic and Kolakovic, 2009) that was regressed against observed values of eddy-covariance ET. The Turc equation performed exceptionally well (r-squared value of 0.94) for reproducing observed daily ET rates. Daily ET values estimated with the Turc equation are identified by a column with a "T" value indicator. Data processing methods were similar to methods...
Categories: Data;
Tags: Blue Cypress Marsh Conservation Area,
Climatology,
Eddy-covariance method,
Evapotranspiration,
Florida,
The dataset consists of a table in Excel format of daily evapotranspiration (ET) from 12/1/2015 to 6/13/2018 at ET station within the Blue Cypress Marsh Conservation Area near Vero Beach, Florida. Evapotranspiration was estimated using eddy-covariance methods. Data processing followed methods outlined by Shoemaker and others (2011). Ancillary data includes net radiation, latent heat, sensible heat, relative humidity, air temperature, water depth above land surface or depth to water below land surface (-), and Bowen's ratio. The site location is 27°41'46", -80°42'43". Released data include mean daily latent heat (LE, in watts per square meter), available energy (Ae, in watts per square meter), and sensible heat (H,...
Categories: Data;
Tags: Blue Cypress Marsh Conservation Area,
Climatology,
Evapotranspiration,
Florida,
Hydrology,
Potential evapotranspiration (PET), and reference evapotranspiration (ETo) are estimated on an approximately 2-kilometer (approximately 0.019 degrees longitude and 0.018 degrees latitude) spatial grid and at a daily time-scale from January 1, 2020 to December 31, 2020 for the entire State of Florida. PET and ETo were computed on the basis of solar radiation, meteorological data (min/max temperature, min/max relative humidity, and mean wind speed at 2-meter height), and shortwave blue-sky albedo data for 2020. Solar radiation was computed from Geostationary Operational Environmental Satellite (GOES) sensor data; blue-sky albedo was computed from the Moderate Resolution Imaging Spectrometer (MODIS) MCD43A1 BRDF/Albedo...
The groundwater discharge area (GDA) in Tule and part of Sevier valley represents the area where discharge from evaporation by open water or bare soil and transpiration from phreatophytic plants exceeds the volume of water contributed by precipitation. The GDA was delineated during field reconnaissance of the study area using techniques similar to those used in previous studies throughout Nevada and eastern Utah.
Categories: Data;
Types: Downloadable,
Map Service,
OGC WFS Layer,
OGC WMS Layer,
Shapefile;
Tags: ET,
Great Basin,
Juab County,
Millard County,
Utah,
PCIC offers statisically downscaled daily climate scenarios, at a gridded resolution of 300 arc-seconds (0.0833 degrees, or roughly 10 km) for the simulated period of 1950-2100. The variables available include minimum temperature, maximum temperature, and precipitation. These downscaling outputs are based on Global Climate Model (GCM) projections from the Coupled Model Intercomparison Project Phase 5 (CMIP5) and historical daily gridded climate data for Canada. Statistical properties and spatial patterns of the downscaled scenarios are based on this gridded observational dataset, which represents one approximation of the actual historical climate. Gridded values may differ from climate stations and biases may...
Categories: Data;
Types: Downloadable,
Map Service,
Raster;
Tags: British Columbia,
Climate Extreme,
Data Visualization & Tools,
Dry Spell,
Evapotranspiration,
The Middle East and North Africa (MENA) region is the most water-scarce region with only two percent of the global average annual rainfall, hence underground aquifers are the major source of water. The need to improve water productivity and increase aquifer storage and recovery (ASR) is driving the efforts for this acceleration of aquifer storage and recovery project. The objective was to model runoff in the study area using multi-source satellite data and identify regions of runoff retention and recharge. Daily runoff is simulated using a saturation excess principle with the VegET model (Senay 2008). It is a spatially explicit (500m grid cell), one-dimensional root-zone water balance model that is driven by precipitation,...
Types: Downloadable,
Map Service,
OGC WFS Layer,
OGC WMS Layer,
OGC WMS Service,
Raster;
Tags: Jordan,
Land Use Change,
Lebanon,
MENA,
NDVI,
Water resource managers rely on hydrologic planning and decision-making models to understand and evaluate current and future water operations in the face of endangered species needs, drought, and climate change. Current climate change projections, such as those used in the West-Wide Climate Risk Assessment programs, are trending toward more extreme instances of drought within the Southern Rockies LCC region. Accurately estimating agricultural water consumption both under present conditions and under modeled future scenarios will help water resource managers project how much water might be available for allocation toward current ecological projects. It will also improve their understanding of the challenges a more...
Categories: Data,
Project;
Types: Map Service,
OGC WFS Layer,
OGC WMS Layer,
OGC WMS Service;
Tags: Decision Support,
Federal resource managers,
Informing Conservation Delivery,
LCC,
LCC Network Science Catalog,
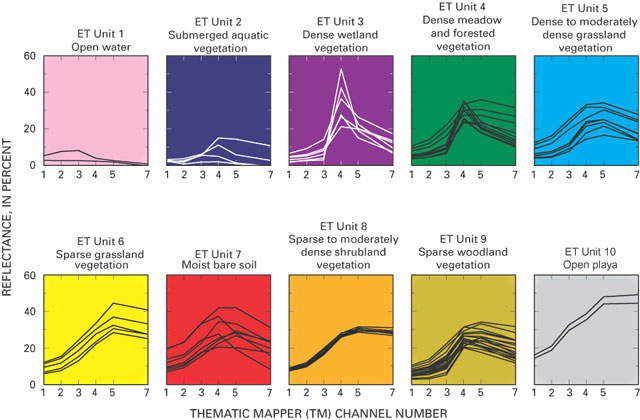
These data were released prior to the October 1, 2016 effective date for the USGS’s policy dictating the review, approval, and release of scientific data as referenced in USGS Survey Manual Chapter 502.8 Fundamental Science Practices: Review and Approval of Scientific Data for Release. The raster-based classification of evapotranspiration (ET) units is for nine major discharge areas in the Death Valley regional flow system. The ET units delineate general areas of similar vegetation and soil-moisture conditions. Classifications were derived from Landsat Thematic Mapper imagery data acquired June 13, 1992; Sept. 1, 1992; and June 21, 1989.
These data were released prior to the October 1, 2016 effective date for the USGS’s policy dictating the review, approval, and release of scientific data as referenced in USGS Survey Manual Chapter 502.8 Fundamental Science Practices: Review and Approval of Scientific Data for Release. The raster-based classification of evapotranspiration (ET) units is for nine major discharge areas in the Death Valley regional flow system. The ET units delineate general areas of similar vegetation and soil-moisture conditions. Classifications were derived from Landsat Thematic Mapper imagery data acquired June 13, 1992; Sept. 1, 1992; and June 21, 1989.

These data were released prior to the October 1, 2016 effective date for the USGS’s policy dictating the review, approval, and release of scientific data as referenced in USGS Survey Manual Chapter 502.8 Fundamental Science Practices: Review and Approval of Scientific Data for Release. This digital data set defines the boundaries of the deserts of the southwestern United States. Those deserts include the Great Basin, Mojave, Colorado, and Sonoran Deserts as defined by Benson and Darrow (1981). The study by Benson and Darrow (1981) was a historical reference used to support development of the transient ground-water model of Death Valley regional ground-water flow system (DVRFS) completed in 2004 by the USGS (see...
|

|
