Filters: Tags: freshwater (X)
106 results (48ms)|
Filters
Date Range
Extensions
Types Contacts
Categories Tag Types
|
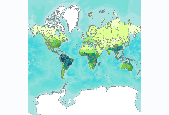
Number of amphibian species, by freshwater ecoregion. We calculated the number of amphibian species per freshwater ecoregion using species range maps of the Global Amphibian Assessment (GAA, www.iucnredlist.org/amphibians) (IUCN et al. 2006). The 2006 GAA assessed 5,918 amphibian species and provided distribution maps for 5,640 of those species. When a range overlapped several ecoregions, we counted species as present in all those ecoregions that had part of the range. This may have resulted in an overestimate of species numbers in some ecoregions, especially those that are long and narrow in shape. This is particularly true for the Amazonas High Andes ecoregion (312), where the mountain range has been used as...

This assessment presents GIS data containing results of all freshwater assessment analyses conducted by The Nature Conservancy for Washington State. This data set includes values for biodiversity metrics (e.g. suitability, threat, number of species) across all HUC6 watersheds in Washington State, as well as identifies rivers, watersheds, and wetlands that provide the best opportunities for conservation of Washington's native freshwater species and ecological systems. Fore more information, visit waconservation.org .
Abstract (from http://onlinelibrary.wiley.com/doi/10.1111/fwb.12290/abstract): Freshwater mussels (Unionidae) are a highly imperilled faunal group. One critical threat is thermal sensitivity, because global climate change and other anthropogenic activities contribute to increasing stream temperature and altered hydrologic flow that may be detrimental to freshwater mussels. We incorporated four benthic environmental components – temperature, sediment, water level (a surrogate for flow) and a vertical thermal gradient in the sediment column – in laboratory mesocosm experiments with juveniles of two species of freshwater mussels (Lampsilis abrupta and Lampsilis radiata) and tested their effects on survival, burrowing...
Categories: Publication;
Types: Citation;
Tags: National CASC,
Other Wildlife,
Wildlife and Plants,
burrowing,
byssus,
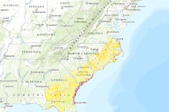
This .zip folder contains final ancillary data layers used to create Southeast Conservation Blueprint 2022 that were not included in the main data download package.
Categories: Data;
Types: Map Service,
OGC WFS Layer,
OGC WMS Layer,
OGC WMS Service;
Tags: Coastal and marine,
Cultural,
Data,
Freshwater,
Indicator,
Citation: Master, Lawrence L., Stephanie R. Flack and Bruce A. Stein, eds. 1998. Rivers of Life: Critical Watersheds for Protecting Freshwater Biodiversity . The Nature Conservancy, Arlington, Virginia. From the report summary: Although at-risk freshwater species can be assessed at the level of states or large regional water- sheds, Rivers of Life: Critical Watersheds for Protecting Freshwater Biodiversity presents the first analysis to define conservation priorities on a scale that is practical for action. Approximately 2,100 small watersheds cover the continental United States. These small watershed areas reflect a scale appropriate for planning and carrying out conservation actions. Using information from natural...
High-angle, open mode fractures control the presence of natural gas hydrate in water-saturated clays at the Keathley Canyon 151 site in the northern Gulf of Mexico, which was investigated for gas hydrates as part of the Chevron Joint Industry Project drilling in 2005. We analyze logging-while-drilling resistivity images and infer that gas hydrate accumulated in situ in two modes: filling fractures and saturating permeable beds. High-angle hydrate-filled fractures are the most common mode for gas hydrate occurrence at this site, with most of these fractures dipping at angles of more than 40° and occurring between 220 and 300 m below seafloor. These fractures all strike approximately N-S, which agrees with the 165°SE-345°NW...
High-angle, open mode fractures control the presence of natural gas hydrate in water-saturated clays at the Keathley Canyon 151 site in the northern Gulf of Mexico, which was investigated for gas hydrates as part of the Chevron Joint Industry Project drilling in 2005. We analyze logging-while-drilling resistivity images and infer that gas hydrate accumulated in situ in two modes: filling fractures and saturating permeable beds. High-angle hydrate-filled fractures are the most common mode for gas hydrate occurrence at this site, with most of these fractures dipping at angles of more than 40° and occurring between 220 and 300 m below seafloor. These fractures all strike approximately N-S, which agrees with the 165°SE-345°NW...
Link to brief summary
We estimated global cyanobacterial biomass in the main reservoirs of cyanobacteria on Earth: marine and freshwater plankton, arid land soil crusts, and endoliths. Estimates were based on typical population density values as measured during our research, or as obtained from literature surveys, which were then coupled with data on global geographical area coverage. Among the marine plankton, the global biomass of Prochlorococcus reaches 120 × 10^12 grams of carbon (g C), and that of Synechoccus some 43 × 10^12 g C. This makes Prochlorococcus and Synechococcus, in that order, the most abundant cyanobacteria on Earth. Tropical marine blooms of Trichodesmium account for an additional 10 × 10^12 g C worldwide. In terrestrial...
Categories: Publication;
Types: Citation,
Journal Citation;
Tags: Algological Studies,
Cyanobacteria,
abundance,
arid land soils,
benthos,
This study uses an integrative approach to study the water-quality impacts of future global climate and land-use changes. In this study, changing land-use types was used as a mitigation strategy to reduce the adverse impacts of global climate change on water resources. The climate scenarios were based on projections made by the Intergovernmental Panel on Climate Change (IPCC) and the United Kingdom Hadley Centre's climate model (HadCM2). The Thornthwaite water-balance model was coupled with a land-use model (L-THIA) to investigate the hydrologic effects of future climate and land-use changes in the Ohio River Basin. The land-use model is based on the Soil Conservation Service's curve-number method. It uses the curve...
Categories: Publication;
Types: Citation;
Tags: ASFA 3: Aquatic Pollution & Environmental Quality,
Climatic changes,
Data Visualization & Tools,
Environment management,
Freshwater,
The need for integrated and widely accessible sources of species traits data to facilitate studies of ecology, conservation, and management has motivated development of traits databases for various taxa. In spite of the increasing number of traits-based analyses of freshwater fishes in the United States, no consolidated database of traits of this group exists publicly, and much useful information on these species is documented only in obscure sources. The largely inaccessible and unconsolidated traits information makes large-scale analysis involving many fishes and/or traits particularly challenging. We have compiled a database of >100 traits for 809 (731 native and 78 nonnative) fish species found in freshwaters...
During 2014-2016, the depth to top of perforated intervals and depth to base of freshwater for oil and gas production wells in California were extracted from well records maintained by the California Division of Oil, Gas, and Geothermal Resources (DOGGR). Well records including geophysical logs, well history, well completion reports, and correspondences were viewed on DOGGR's Well Finder website at https://maps.conservation.ca.gov/doggr/wellfinder/. This digital dataset contains 3,505 records for production wells, of which 2,964 wells have a recorded depth to top of perforated intervals and 1,494 wells have a recorded depth to base of freshwater. Wells were attributed with American Petroleum Institute (API) numbers,...
Categories: Data;
Tags: California,
Western United States,
environmental resources,
freshwater,
groundwater,
Fish collections made at Buck Island Reef National Monument with the ichthyocide rotenone in 2001 at 58 stations followed by 10 days each in April 2011 and January 2012 surveying poorly sampled shoreline habitats with rotenone and clove oil and inland streams with seine. Attached files: Original metadata created at the Southeast Ecological Science Center - Jelks_St_Croix_2001-2012.xml Original dataset provided by M. Cannister - Jelks_St_Croix_2001-2012_orig.csv Enrollment journal used to crosswalk the original data into MBG format - OBIS-USA Enrollment Journal Virgin Islands Jelks 20140626.doc Final MBG version of the data after processing - USGS_StCroix_MarineFishesMBG_20140702.csv Intermediate file created by...
This U.S. Geological Survey (USGS) Data Release provides phytoplankton data collected from Milford Lake, Kansas, during May through November 2016. This data release was produced in compliance with the federal open-data requirements as a way to make scientific products associated with USGS research efforts and publications available to the public. The dataset includes all samples collected at 37 USGS sample locations at Milford Lake. Phytoplankton were identified to the lowest possible taxonomic level and abundance (density) and biovolume are reported.
FY2014This project builds upon the springs and seeps inventory funded by the Desert LCC.This project will: Fill a significant gap in aquatic habitat information for scenario planning. Create a publically available geospatial database of approximately 2,000+ known Great Basin springs. Create a summary report on the biotic and abiotic conditions of the known springs.
Categories: Data,
Project;
Types: Map Service,
OGC WFS Layer,
OGC WMS Layer,
OGC WMS Service;
Tags: Academics & scientific researchers,
California,
California,
California,
California,
This U.S. Geological Survey (USGS) data release contains phytoplankton classification and enumeration results from near-surface samples analyzed by imaging flow cytometry and collected as part of a harmful algae bloom (HAB) monitoring study conducted in collaboration with the New York State Department of Environmental Conservation (NYSDEC). Samples were collected biweekly from monitoring platforms in Owasco and Seneca Lakes and one bloom sample site at Emerson Park Boat Launch in Owasco Lake. The platforms were deployed from June-October in 2020. This dataset includes all routine and quality assurance/quality control samples collected at the three sampling locations. Phytoplankton were identified to the lowest possible...
Categories: Data;
Tags: Algae,
Algae,
Cayuga County,
Division,
Ecological Assessment of Human and Natural Impacts,
This study set out to answer the question: “What data and modeling frameworks are needed to provide scientists reliable, climate-informed, water temperature estimates for freshwater ecosystems that can assist watershed management decision making?” To accomplish this, researchers gathered existing stream temperature data, identified data gaps, deployed stream temperature monitoring devices, and developed and tested a stream temperature model that could be regionalized across the Northeast Climate Science Center (NE CSC) domain. Polebitski and colleagues partnered with another NE CSC funded project team, NorEaST-Stream Temperature Web Portal Demonstration and Application, led by Jana Stewart (USGS Wisconsin Water...
Categories: Publication;
Types: Citation;
Tags: Data Visualization & Tools,
Freshwater,
Modeling,
Northeast CASC,
Science Tools For Managers,

Number of freshwater fish species, by freshwater ecoregion. The map of freshwater fish species richness—the number of species present in each ecoregion—was generated from a variety of sources by Abell et al. (2008). Only species using freshwater for at least a portion of their life cycles, as identified using the habitat assignments in FishBase, are included. For the United States, NatureServe provided presence/absence data for individual species, coded to eight-digit hydrologic unit codes (HUCs); these HUC occurrences were then translated into ecoregions, and the data were manually cleaned of erroneous occurrences derived from species introductions and problematic records. For all other ecoregions, species lists...

Number of migratory fish species, by freshwater ecoregion. We derived the map of long-distance migrant (LDM) fish—the number of LDM species per ecoregion—from published literature, online databases (NatureServe), and expert inquiries. Potadromous, anadromous, amphidromous, and catadromous fish species were judged to be LDMs if they made regular journeys (i.e., for breeding, dispersal, feeding) of at least a hundred kilometers or more in freshwater. These species were then assigned to ecoregions based on the fish species lists database from Abell et al. (2008). Although we used many resources, two key data sources for the map were the following: Carolsfeld, J., B. Harvey, C. Ross, and A. Baer, eds. 2003. Migratory...
To inform the design and implementation of land-use policies that consider the variety of goods and services people derive from ecosystems, it is essential to understand spatial patterns of individual services, how multiple services relate to each other, and how these relationships vary across spatial scales and localities. Despite the importance of freshwater as a determinant of regional economic and human demographic patterns, there are surprisingly few studies that map the provision of a range of services associated with the quality of the aquatic environment. Here we examine relationships between indicators of riverine water and associated habitat quality, freshwater biodiversity, three terrestrial ecosystem...
|

|
