Filters: Tags: gcm (X)
528 results (14ms)|
Filters
Date Range
Extensions Types Contacts
Categories Tag Types
|

Using the simple anomaly method (modifying a historical baseline with differences or ratios projected by General Circulation Models), scientists from the California Academy of Sciences downscaled monthly average temperature and monthly total precipitation from 16 different global circulation models (GCMs). The GCMs were described in the latest Intergovernmental Panel for Climate Change (IPCC 2007) and archived at the WCRP PCMDI (http://www-pcmdi.llnl.gov/ipcc/about_ipcc.php). Monthly maximum temperature and monthly minimum temperatures were downscaled from the only 6 GCMs that archived these particular variables. Scientists used Worldclim v.1.4 (Hijmans et al 2005) at 5 arc-minute (~10km) spatial grain as the current...

Using the simple anomaly method (modifying a historical baseline with differences or ratios projected by General Circulation Models), scientists from the California Academy of Sciences downscaled monthly average temperature and monthly total precipitation from 16 different global circulation models (GCMs). The GCMs were described in the latest Intergovernmental Panel for Climate Change (IPCC 2007) and archived at the WCRP PCMDI (http://www-pcmdi.llnl.gov/ipcc/about_ipcc.php). Monthly maximum temperature and monthly minimum temperatures were downscaled from the only 6 GCMs that archived these particular variables. Scientists used Worldclim v.1.4 (Hijmans et al 2005) at 5 arc-minute (~10km) spatial grain as the current...

Using the simple anomaly method (modifying a historical baseline with differences or ratios projected by General Circulation Models), scientists from the California Academy of Sciences downscaled monthly average temperature and monthly total precipitation from 16 different global circulation models (GCMs). The GCMs were described in the latest Intergovernmental Panel for Climate Change (IPCC 2007) and archived at the WCRP PCMDI (http://www-pcmdi.llnl.gov/ipcc/about_ipcc.php). Monthly maximum temperature and monthly minimum temperatures were downscaled from the only 6 GCMs that archived these particular variables. Scientists used Worldclim v.1.4 (Hijmans et al 2005) at 5 arc-minute (~10km) spatial grain as the current...

Using the simple anomaly method (modifying a historical baseline with differences or ratios projected by General Circulation Models), scientists from the California Academy of Sciences downscaled monthly average temperature and monthly total precipitation from 16 different global circulation models (GCMs). The GCMs were described in the latest Intergovernmental Panel for Climate Change (IPCC 2007) and archived at the WCRP PCMDI (http://www-pcmdi.llnl.gov/ipcc/about_ipcc.php). Monthly maximum temperature and monthly minimum temperatures were downscaled from the only 6 GCMs that archived these particular variables. Scientists used Worldclim v.1.4 (Hijmans et al 2005) at 5 arc-minute (~10km) spatial grain as the current...

Using the simple anomaly method (modifying a historical baseline with differences or ratios projected by General Circulation Models), scientists from the California Academy of Sciences downscaled monthly average temperature and monthly total precipitation from 16 different global circulation models (GCMs). The GCMs were described in the latest Intergovernmental Panel for Climate Change (IPCC 2007) and archived at the WCRP PCMDI (http://www-pcmdi.llnl.gov/ipcc/about_ipcc.php). Monthly maximum temperature and monthly minimum temperatures were downscaled from the only 6 GCMs that archived these particular variables. Scientists used Worldclim v.1.4 (Hijmans et al 2005) at 5 arc-minute (~10km) spatial grain as the current...

Ken Ferschweiler (CBI) used climate data from the PRISM group (Chris Daly, Oregon State University) at 4kmx4km spatial grain across the conterminous USA to generate a climatology or baseline. He then created future climate change scenarios using statistical downscaling and created anomalies from the Hadley CM3 General Circulation Model (GCM) run through the A2 emission scenario (SRES - special report on emission scenarios published in 2000). To run the MAPSS model (Neilson 1995), average monthly precipitation values were calculated for the period 2045-2060. This dataset shows the standard deviation of the annual precipitation for that period.

The Nature Conservancy (TNC) has derived climate suitability forecasts for most species of trees and shrubs considered to be ecological dominants of terrestrial Californian habitat types. Our plant projections are compiled as decision support tools to help Conservancy project staff, as well as our external partners, develop the necessary plans, priorities and strategies to successfully adapt to uncertain changes in future climate. In the recently completed Southern Sierra Partnership's 2010 Climate-Adapted Conservation Plan for the Southern Sierra Nevada and Tehachapi Mountains, species and habitat forecasts shown here informed the development of a regional conservation design that explicitly incorporates long-term...
The Nature Conservancy (TNC) has derived climate suitability forecasts for most species of trees and shrubs considered to be ecological dominants of terrestrial Californian habitat types. Our plant projections are compiled as decision support tools to help Conservancy project staff, as well as our external partners, develop the necessary plans, priorities and strategies to successfully adapt to uncertain changes in future climate. In the recently completed Southern Sierra Partnership's 2010 Climate-Adapted Conservation Plan for the Southern Sierra Nevada and Tehachapi Mountains, species and habitat forecasts shown here informed the development of a regional conservation design that explicitly incorporates long-term...
The Nature Conservancy (TNC) has derived climate suitability forecasts for most species of trees and shrubs considered to be ecological dominants of terrestrial Californian habitat types. Our plant projections are compiled as decision support tools to help Conservancy project staff, as well as our external partners, develop the necessary plans, priorities and strategies to successfully adapt to uncertain changes in future climate. In the recently completed Southern Sierra Partnership's 2010 Climate-Adapted Conservation Plan for the Southern Sierra Nevada and Tehachapi Mountains, species and habitat forecasts shown here informed the development of a regional conservation design that explicitly incorporates long-term...

The Nature Conservancy (TNC) has derived climate suitability forecasts for most species of trees and shrubs considered to be ecological dominants of terrestrial Californian habitat types. Our plant projections are compiled as decision support tools to help Conservancy project staff, as well as our external partners, develop the necessary plans, priorities and strategies to successfully adapt to uncertain changes in future climate. In the recently completed Southern Sierra Partnership's 2010 Climate-Adapted Conservation Plan for the Southern Sierra Nevada and Tehachapi Mountains, species and habitat forecasts shown here informed the development of a regional conservation design that explicitly incorporates long-term...

The Nature Conservancy (TNC) has derived climate suitability forecasts for most species of trees and shrubs considered to be ecological dominants of terrestrial Californian habitat types. Our plant projections are compiled as decision support tools to help Conservancy project staff, as well as our external partners, develop the necessary plans, priorities and strategies to successfully adapt to uncertain changes in future climate. In the recently completed Southern Sierra Partnership's 2010 Climate-Adapted Conservation Plan for the Southern Sierra Nevada and Tehachapi Mountains, species and habitat forecasts shown here informed the development of a regional conservation design that explicitly incorporates long-term...

The Nature Conservancy (TNC) has derived climate suitability forecasts for most species of trees and shrubs considered to be ecological dominants of terrestrial Californian habitat types. Our plant projections are compiled as decision support tools to help Conservancy project staff, as well as our external partners, develop the necessary plans, priorities and strategies to successfully adapt to uncertain changes in future climate. In the recently completed Southern Sierra Partnership's 2010 Climate-Adapted Conservation Plan for the Southern Sierra Nevada and Tehachapi Mountains, species and habitat forecasts shown here informed the development of a regional conservation design that explicitly incorporates long-term...
The Nature Conservancy (TNC) has derived climate suitability forecasts for most species of trees and shrubs considered to be ecological dominants of terrestrial Californian habitat types. Our plant projections are compiled as decision support tools to help Conservancy project staff, as well as our external partners, develop the necessary plans, priorities and strategies to successfully adapt to uncertain changes in future climate. In the recently completed Southern Sierra Partnership's 2010 Climate-Adapted Conservation Plan for the Southern Sierra Nevada and Tehachapi Mountains, species and habitat forecasts shown here informed the development of a regional conservation design that explicitly incorporates long-term...

Using the simple anomaly method (modifying a historical baseline with differences or ratios projected by General Circulation Models), scientists from the California Academy of Sciences downscaled monthly average temperature and monthly total precipitation from 16 different global circulation models (GCMs). The GCMs were described in the latest Intergovernmental Panel for Climate Change (IPCC 2007) and archived at the WCRP PCMDI (http://www-pcmdi.llnl.gov/ipcc/about_ipcc.php). Monthly maximum temperature and monthly minimum temperatures were downscaled from the only 6 GCMs that archived these particular variables. Scientists used Worldclim v.1.4 (Hijmans et al 2005) at 5 arc-minute (~10km) spatial grain as the current...

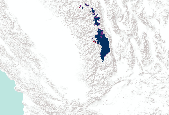
Standard deviation for spring minimum temperature (Celsius), 2060-2079, 6 GCMs, B1 emission scenario
Using the simple anomaly method (modifying a historical baseline with differences or ratios projected by General Circulation Models), scientists from the California Academy of Sciences downscaled monthly average temperature and monthly total precipitation from 16 different global circulation models (GCMs). The GCMs were described in the latest Intergovernmental Panel for Climate Change (IPCC 2007) and archived at the WCRP PCMDI (http://www-pcmdi.llnl.gov/ipcc/about_ipcc.php). Monthly maximum temperature and monthly minimum temperatures were downscaled from the only 6 GCMs that archived these particular variables. Scientists used Worldclim v.1.4 (Hijmans et al 2005) at 5 arc-minute (~10km) spatial grain as the current...

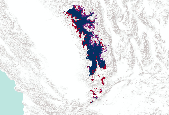
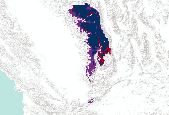
Using the simple anomaly method (modifying a historical baseline with differences or ratios projected by General Circulation Models), scientists from the California Academy of Sciences downscaled monthly total precipitation from 16 different global circulation models (GCMs). The GCMs were described in the latest Intergovernmental Panel for Climate Change (IPCC 2007) and archived at the WCRP PCMDI ( http://www-pcmdi.llnl.gov/ipcc/about_ipcc.php). Monthly total precipitation was downscaled using the ratio between each 20 year-period in the future (e.g. 2040-2059) and the simulated historical average (1950-2000) from each GCM. Each layer was then interpolated to a spatial grain of 10x10 km2 using the regularized spline...

Using the simple anomaly method (modifying a historical baseline with differences or ratios projected by General Circulation Models), scientists from the California Academy of Sciences downscaled monthly total precipitation from 16 different global circulation models (GCMs). The GCMs were described in the latest Intergovernmental Panel for Climate Change (IPCC 2007) and archived at the WCRP PCMDI ( http://www-pcmdi.llnl.gov/ipcc/about_ipcc.php). Monthly total precipitation was downscaled using the ratio between each 20 year-period in the future (e.g. 2040-2059) and the simulated historical average (1950-2000) from each GCM. Each layer was then interpolated to a spatial grain of 10x10 km2 using the regularized spline...

Using the simple anomaly method (modifying a historical baseline with differences or ratios projected by General Circulation Models), scientists from the California Academy of Sciences downscaled monthly total precipitation from 16 different global circulation models (GCMs). The GCMs were described in the latest Intergovernmental Panel for Climate Change (IPCC 2007) and archived at the WCRP PCMDI ( http://www-pcmdi.llnl.gov/ipcc/about_ipcc.php). Monthly total precipitation was downscaled using the ratio between each 20 year-period in the future (e.g. 2040-2059) and the simulated historical average (1950-2000) from each GCM. Each layer was then interpolated to a spatial grain of 10x10 km2 using the regularized spline...

Using the simple anomaly method (modifying a historical baseline with differences or ratios projected by General Circulation Models), scientists from the California Academy of Sciences downscaled monthly total precipitation from 16 different global circulation models (GCMs). The GCMs were described in the latest Intergovernmental Panel for Climate Change (IPCC 2007) and archived at the WCRP PCMDI ( http://www-pcmdi.llnl.gov/ipcc/about_ipcc.php). Monthly total precipitation was downscaled using the ratio between each 20 year-period in the future (e.g. 2040-2059) and the simulated historical average (1950-2000) from each GCM. Each layer was then interpolated to a spatial grain of 10x10 km2 using the regularized spline...

Using the simple anomaly method (modifying a historical baseline with differences or ratios projected by General Circulation Models), scientists from the California Academy of Sciences downscaled monthly total precipitation from 16 different global circulation models (GCMs). The GCMs were described in the latest Intergovernmental Panel for Climate Change (IPCC 2007) and archived at the WCRP PCMDI ( http://www-pcmdi.llnl.gov/ipcc/about_ipcc.php). Monthly total precipitation was downscaled using the ratio between each 20 year-period in the future (e.g. 2040-2059) and the simulated historical average (1950-2000) from each GCM. Each layer was then interpolated to a spatial grain of 10x10 km2 using the regularized spline...
|

|
