Filters: Tags: geospatial analysis (X)
808 results (40ms)|
Filters
Date Range
Extensions Types Contacts
Categories
Tag Types
|
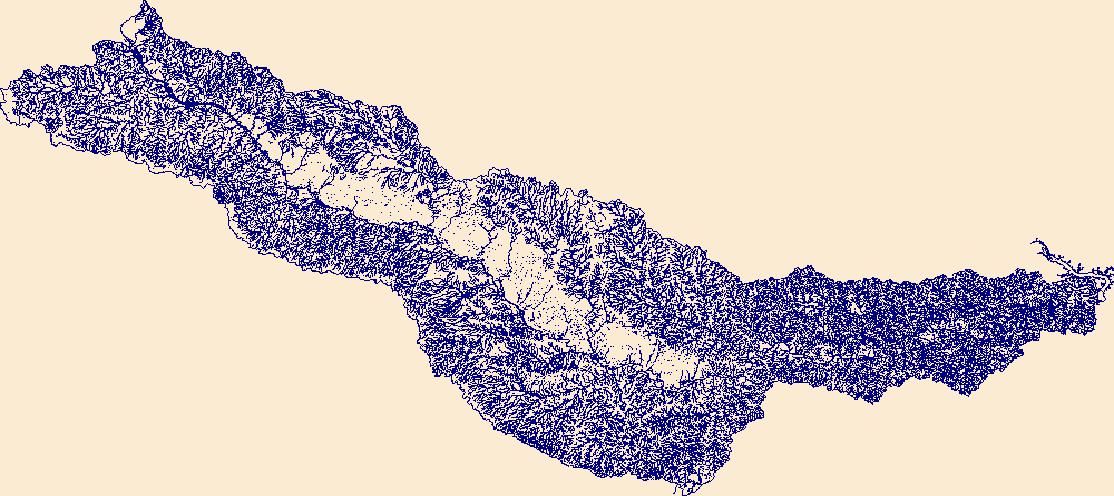
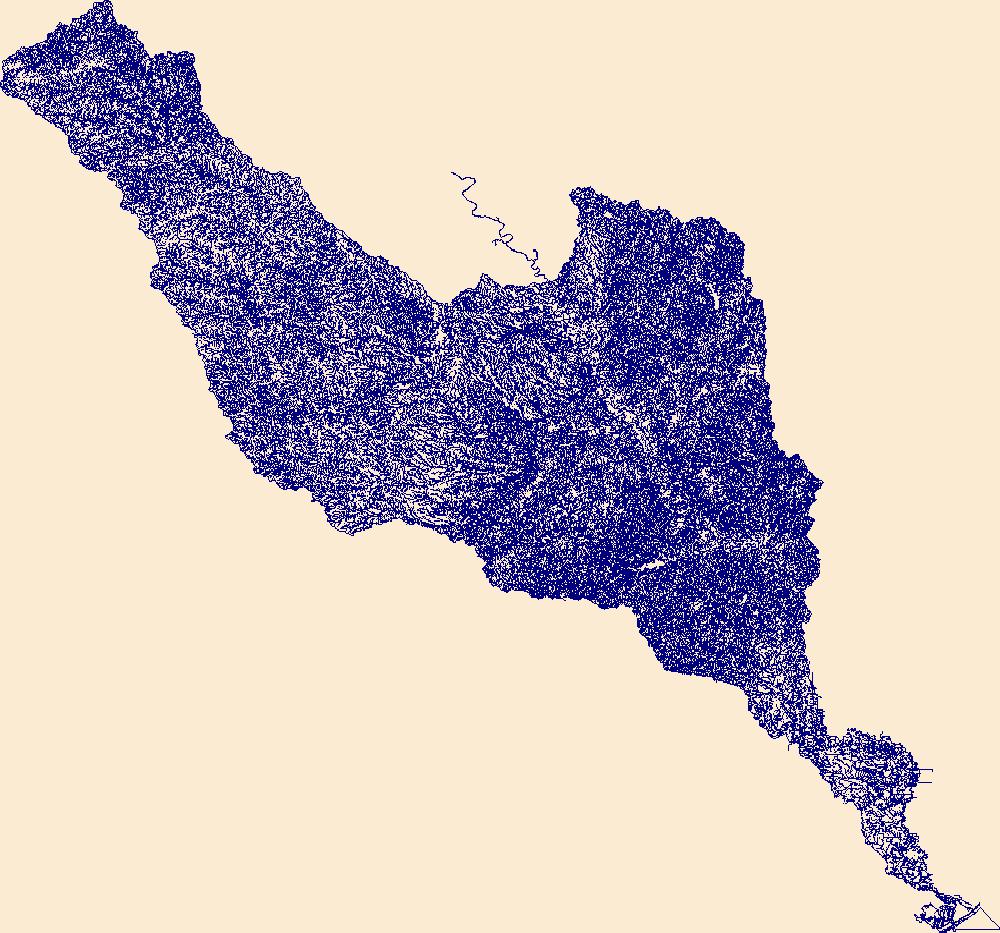
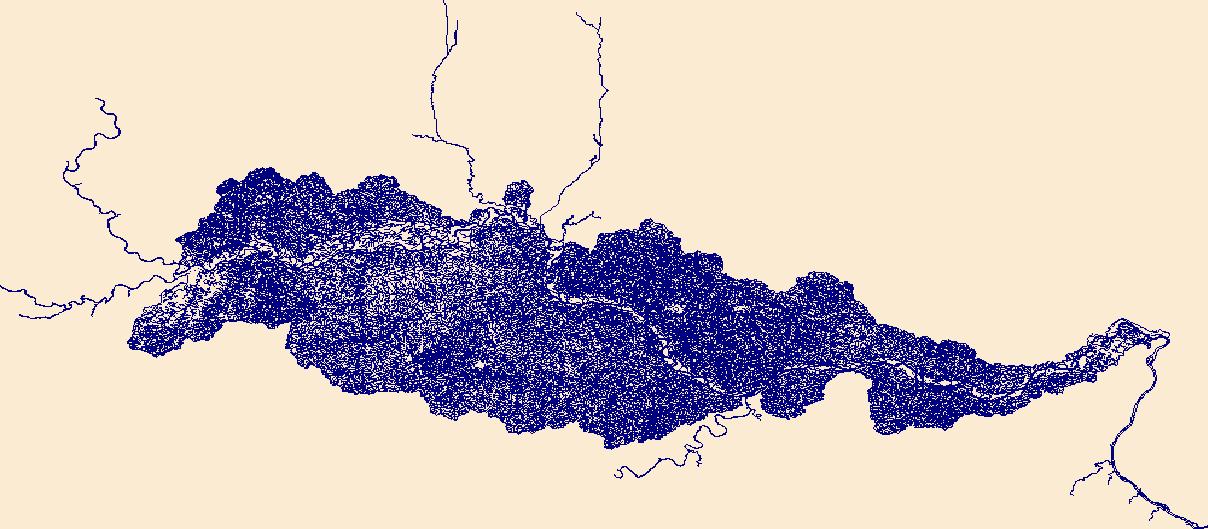
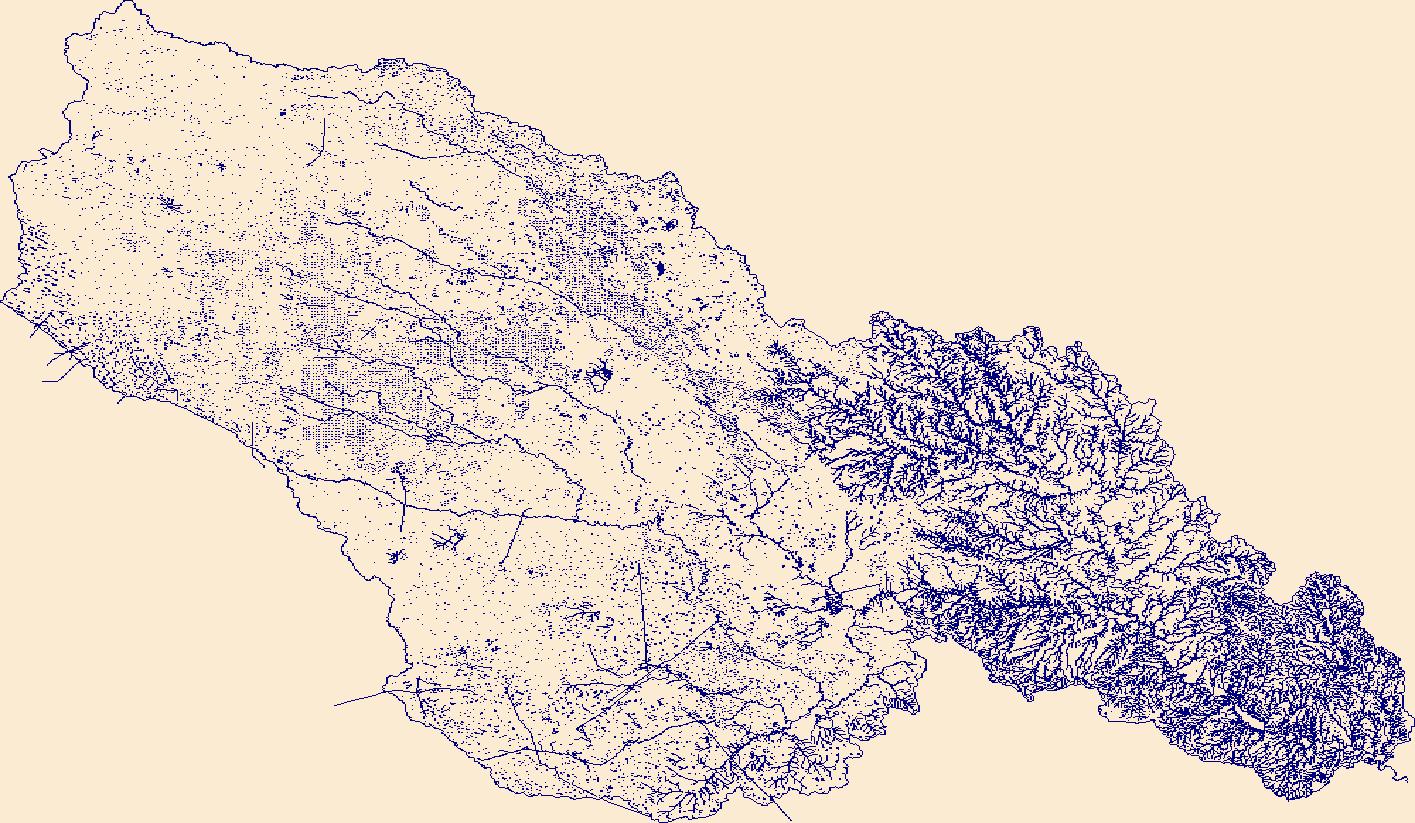
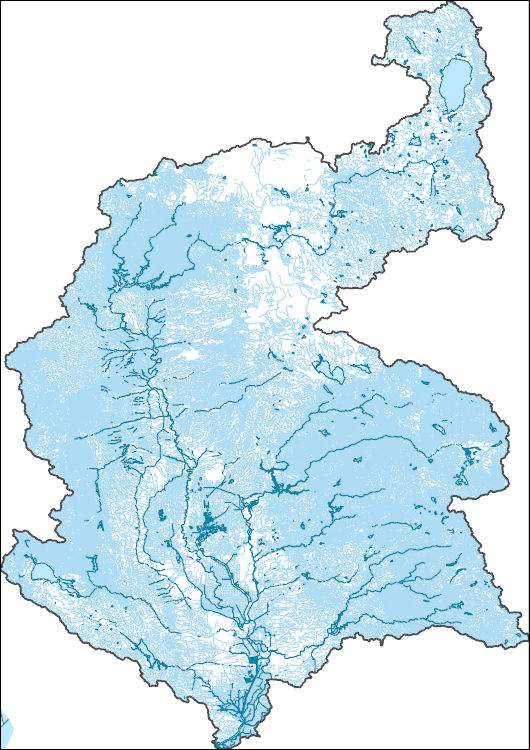
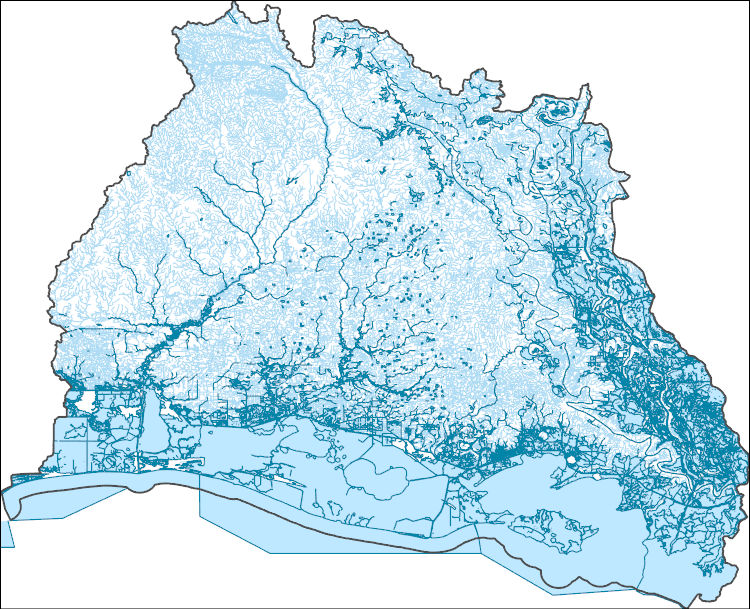
The High Resolution National Hydrography Dataset Plus (NHDPlus HR) is an integrated set of geospatial data layers, including the best available National Hydrography Dataset (NHD), the 10-meter 3D Elevation Program Digital Elevation Model (3DEP DEM), and the National Watershed Boundary Dataset (WBD). The NHDPlus HR combines the NHD, 3DEP DEMs, and WBD to create a stream network with linear referencing, feature naming, "value added attributes" (VAAs), elevation-derived catchments, and other features for hydrologic data analysis. The stream network with linear referencing is a system of data relationships applied to hydrographic systems so that one stream reach "flows" into another and "events" can be tied to and traced...
The High Resolution National Hydrography Dataset Plus (NHDPlus HR) is an integrated set of geospatial data layers, including the best available National Hydrography Dataset (NHD), the 10-meter 3D Elevation Program Digital Elevation Model (3DEP DEM), and the National Watershed Boundary Dataset (WBD). The NHDPlus HR combines the NHD, 3DEP DEMs, and WBD to create a stream network with linear referencing, feature naming, "value added attributes" (VAAs), elevation-derived catchments, and other features for hydrologic data analysis. The stream network with linear referencing is a system of data relationships applied to hydrographic systems so that one stream reach "flows" into another and "events" can be tied to and traced...
The High Resolution National Hydrography Dataset Plus (NHDPlus HR) is an integrated set of geospatial data layers, including the best available National Hydrography Dataset (NHD), the 10-meter 3D Elevation Program Digital Elevation Model (3DEP DEM), and the National Watershed Boundary Dataset (WBD). The NHDPlus HR combines the NHD, 3DEP DEMs, and WBD to create a stream network with linear referencing, feature naming, "value added attributes" (VAAs), elevation-derived catchments, and other features for hydrologic data analysis. The stream network with linear referencing is a system of data relationships applied to hydrographic systems so that one stream reach "flows" into another and "events" can be tied to and traced...
The High Resolution National Hydrography Dataset Plus (NHDPlus HR) is an integrated set of geospatial data layers, including the best available National Hydrography Dataset (NHD), the 10-meter 3D Elevation Program Digital Elevation Model (3DEP DEM), and the National Watershed Boundary Dataset (WBD). The NHDPlus HR combines the NHD, 3DEP DEMs, and WBD to create a stream network with linear referencing, feature naming, "value added attributes" (VAAs), elevation-derived catchments, and other features for hydrologic data analysis. The stream network with linear referencing is a system of data relationships applied to hydrographic systems so that one stream reach "flows" into another and "events" can be tied to and traced...
The High Resolution National Hydrography Dataset Plus (NHDPlus HR) is an integrated set of geospatial data layers, including the best available National Hydrography Dataset (NHD), the 10-meter 3D Elevation Program Digital Elevation Model (3DEP DEM), and the National Watershed Boundary Dataset (WBD). The NHDPlus HR combines the NHD, 3DEP DEMs, and WBD to create a stream network with linear referencing, feature naming, "value added attributes" (VAAs), elevation-derived catchments, and other features for hydrologic data analysis. The stream network with linear referencing is a system of data relationships applied to hydrographic systems so that one stream reach "flows" into another and "events" can be tied to and traced...
The High Resolution National Hydrography Dataset Plus (NHDPlus HR) is an integrated set of geospatial data layers, including the best available National Hydrography Dataset (NHD), the 10-meter 3D Elevation Program Digital Elevation Model (3DEP DEM), and the National Watershed Boundary Dataset (WBD). The NHDPlus HR combines the NHD, 3DEP DEMs, and WBD to create a stream network with linear referencing, feature naming, "value added attributes" (VAAs), elevation-derived catchments, and other features for hydrologic data analysis. The stream network with linear referencing is a system of data relationships applied to hydrographic systems so that one stream reach "flows" into another and "events" can be tied to and traced...
Scientists within the Geospatial Analyses and Applications Team develop and apply geospatial analytical methods to answer broad-scale questions about source-sink and cause-effect relationships between contaminants and vulnerable communities. Multivariate statistics are used to identify connections between landscape gradients and observational data. These connections are used to develop risk assessments and make predictions across broad, regional scales. Datasets and analytical tools developed by the CTT support multiple projects seeking to understand complex source-sink relationships between observational data and landscape characteristics. Datasets, tools, and methods detailed and stored on this community page...

The domain of the model is as follows: Row River from Dorena dam to the confluence with the Coast Fork; Coast Fork from Cottage Grove dam to the confluence with the Middle Fork; Silk Creek from River Mile 1.7 to the confluence with the Coast Fork. The basis for these features is the Willamette Flood Insurance Study – Phase One (2013). The hydraulics and hydrology for the FIS were reused in the production of these polygons; the reports and information associated with the FIS are applicable to this product. The Digital Elevation Model (DEM) utilized for the Willamette FIS submittal was produced by combining multiple overlapping topographic surveys for the Middle Fork and Coast Fork of the Willamette River. This DEM...

The domain of the model is as follows: Row River from Dorena dam to the confluence with the Coast Fork; Coast Fork from Cottage Grove dam to the confluence with the Middle Fork; Silk Creek from River Mile 1.7 to the confluence with the Coast Fork. The basis for these features is the Willamette Flood Insurance Study – Phase One (2013). The hydraulics and hydrology for the FIS were reused in the production of these polygons; the reports and information associated with the FIS are applicable to this product. The Digital Elevation Model (DEM) utilized for the Willamette FIS submittal was produced by combining multiple overlapping topographic surveys for the Middle Fork and Coast Fork of the Willamette River. This DEM...

The domain of the model is as follows: Row River from Dorena dam to the confluence with the Coast Fork; Coast Fork from Cottage Grove dam to the confluence with the Middle Fork; Silk Creek from River Mile 1.7 to the confluence with the Coast Fork. The basis for these features is the Willamette Flood Insurance Study – Phase One (2013). The hydraulics and hydrology for the FIS were reused in the production of these polygons; the reports and information associated with the FIS are applicable to this product. The Digital Elevation Model (DEM) utilized for the Willamette FIS submittal was produced by combining multiple overlapping topographic surveys for the Middle Fork and Coast Fork of the Willamette River. This DEM...
The High Resolution National Hydrography Dataset Plus (NHDPlus HR) is an integrated set of geospatial data layers, including the best available National Hydrography Dataset (NHD), the 10-meter 3D Elevation Program Digital Elevation Model (3DEP DEM), and the National Watershed Boundary Dataset (WBD). The NHDPlus HR combines the NHD, 3DEP DEMs, and WBD to create a stream network with linear referencing, feature naming, "value added attributes" (VAAs), elevation-derived catchments, and other features for hydrologic data analysis. The stream network with linear referencing is a system of data relationships applied to hydrographic systems so that one stream reach "flows" into another and "events" can be tied to and traced...
The High Resolution National Hydrography Dataset Plus (NHDPlus HR) is an integrated set of geospatial data layers, including the best available National Hydrography Dataset (NHD), the 10-meter 3D Elevation Program Digital Elevation Model (3DEP DEM), and the National Watershed Boundary Dataset (WBD). The NHDPlus HR combines the NHD, 3DEP DEMs, and WBD to create a stream network with linear referencing, feature naming, "value added attributes" (VAAs), elevation-derived catchments, and other features for hydrologic data analysis. The stream network with linear referencing is a system of data relationships applied to hydrographic systems so that one stream reach "flows" into another and "events" can be tied to and traced...
A high-resolution raster dataset of simulated maximum tsunami elevations in Santa Cruz, California, based on the Science Application for Risk Reduction (SAFRR) tsunami scenario.
Categories: Data;
Types: Downloadable,
GeoTIFF,
Map Service,
Raster;
Tags: CMHRP,
Coastal and Marine Hazards and Resources Program,
PCMSC,
Pacific Coastal and Marine Science Center,
Predictions,
A two-dimensional model and digital flood-inundation maps were developed for a 30-mile reach of the Wabash River near the Interstate 64 (I-64) Bridge near Grayville, Illinois. The flood-inundation maps, which can be accessed through the U.S. Geological Survey (USGS) Flood Inundation Mapping Science web site at http://water.usgs.gov/osw/flood_inundation/, depict estimates of the areal extent and depth of flooding corresponding to selected water levels (stages) at the USGS streamgage on the Wabash River at Mount Carmel, Ill (USGS station number 03377500). Near-real-time stages at this streamgage may be obtained on the internet from the USGS National Water Information System at http://waterdata.usgs.gov/ or the National...
Categories: Data;
Types: Citation;
Tags: Geomorphology,
Gibson County,
Grayville,
Hydrogeology,
Illinois,
In 2013, the first of several Regional Stream Quality Assessments (RSQA) was done in the Midwest United States. The Midwest Stream Quality Assessment (MSQA) was a collaborative study by the U.S. Geological Survey (USGS) National Water Quality Assessment (NAWQA), the USGS Columbia Environmental Research Center, and the U.S. Environmental Protection Agency (USEPA) National Rivers and Streams Assessment (NRSA). One of the objectives of the RSQA, and thus the MSQA, is to characterize the relationships between water-quality stressors and stream ecology and to determine the relative effects of these stressors on aquatic biota within the streams (U.S. Geological Survey, 2012). To meet this objective, a framework of fundamental...
Categories: Data;
Types: Citation,
Downloadable,
Map Service,
OGC WFS Layer,
OGC WMS Layer,
Shapefile;
Tags: Ecological reach,
Geographic Information Systems,
Geospatial Analysis,
Geospatial Datasets,
Illinois,
Digital flood-inundation maps for a 9.5-mile reach of the Patoka River in and near the city of Jasper, southwestern Indiana, from the streamgage near County Road North 175 East, downstream to State Road 162, were created by the U.S. Geological Survey (USGS) in cooperation with the Indiana Department of Transportation. The flood-inundation maps, which can be accessed through the USGS Flood Inundation Mapping Science Web site at http://water.usgs.gov/osw/flood_inundation/, depict estimates of the areal extent and depth of flooding corresponding to selected water levels (stages) at the USGS streamgage Patoka River at Jasper, Indiana (station number 03375500). The Patoka streamgage is located at the upstream end of...
Digital flood-inundation maps for a 7.6-mile reach of the Meramec River at Fenton, Missouri, were created by the U.S. Geological Survey (USGS) in cooperation with the US Army Corps of Engineers, St. Louis Metropolitan Sewer District, Missouri Department of Transportation, Missouri American Water, and Federal Emergency Management Agency Region 7. The flood-inundation maps, which can be accessed through the USGS Flood Inundation Mapping Science Web site at http://water.usgs.gov/osw/flood_inundation/, depict estimates of the areal extent and depth of flooding corresponding to selected water levels (stages) at the USGS streamgage on the Meramec River at Fenton, Missouri (station number 07019210). Near-real-time stages...
Types: Citation,
Map Service,
OGC WFS Layer,
OGC WMS Layer,
OGC WMS Service;
Tags: Eureka,
Fenton,
Meramec River,
Missouri,
Valley Park,
Understanding how sea-level rise will affect coastal landforms and the species and habitats they support is critical for crafting approaches that balance the needs of humans and native species. Given this increasing need to forecast sea-level rise effects on barrier islands in the near and long terms, we are developing Bayesian networks to evaluate and to forecast the cascading effects of sea-level rise on shoreline change, barrier island state, and piping plover habitat availability. We use publicly available data products, such as lidar, orthophotography, and geomorphic feature sets derived from those, to extract metrics of barrier island characteristics at consistent sampling distances. The metrics are then incorporated...
Categories: Data;
Types: Downloadable,
GeoTIFF,
Map Service,
Raster;
Tags: Atlantic Ocean,
Barrier Island,
CMGP,
Coastal Habitat,
Coastal and Marine Geology Program,
Understanding how sea-level rise will affect coastal landforms and the species and habitats they support is critical for crafting approaches that balance the needs of humans and native species. Given this increasing need to forecast sea-level rise effects on barrier islands in the near and long terms, we are developing Bayesian networks to evaluate and to forecast the cascading effects of sea-level rise on shoreline change, barrier island state, and piping plover habitat availability. We use publicly available data products, such as lidar, orthophotography, and geomorphic feature sets derived from those, to extract metrics of barrier island characteristics at consistent sampling distances. The metrics are then incorporated...
Categories: Data;
Types: Downloadable,
GeoTIFF,
Map Service,
Raster;
Tags: Atlantic Ocean,
Barrier Island,
Bayesian Network,
CMGP,
Cedar Island,
Understanding how sea-level rise will affect coastal landforms and the species and habitats they support is critical for crafting approaches that balance the needs of humans and native species. Given this increasing need to forecast sea-level rise effects on barrier islands in the near and long terms, we are developing Bayesian networks to evaluate and to forecast the cascading effects of sea-level rise on shoreline change, barrier island state, and piping plover habitat availability. We use publicly available data products, such as lidar, orthophotography, and geomorphic feature sets derived from those, to extract metrics of barrier island characteristics at consistent sampling distances. The metrics are then incorporated...
Categories: Data;
Types: Downloadable,
GeoTIFF,
Map Service,
Raster;
Tags: Atlantic Ocean,
Barrier Island,
CMGP,
Coastal Habitat,
Coastal and Marine Geology Program,
|

|
